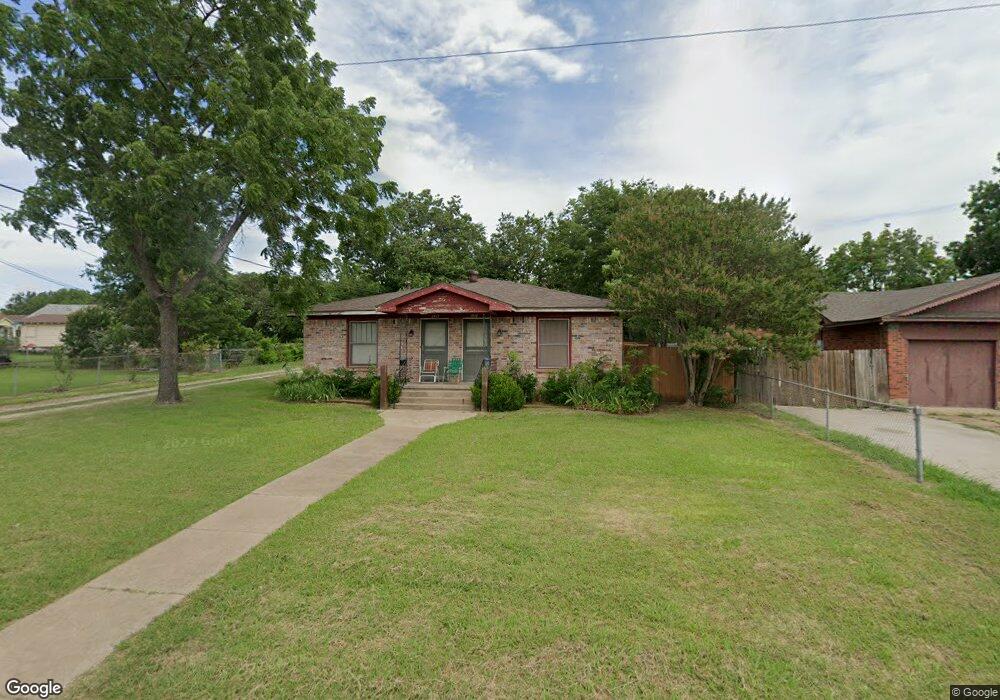
1917 E Houston St Unit 1919 Sherman, TX 75090
Estimated Value: $250,000
--
Bed
--
Bath
1,400
Sq Ft
$179/Sq Ft
Est. Value
About This Home
This home is located at 1917 E Houston St Unit 1919, Sherman, TX 75090 and is currently estimated at $250,000, approximately $178 per square foot. 1917 E Houston St Unit 1919 is a home located in Grayson County with nearby schools including Crutchfield Elementary School, Piner Middle School, and Dillingham Intermediate School.
Create a Home Valuation Report for This Property
The Home Valuation Report is an in-depth analysis detailing your home's value as well as a comparison with similar homes in the area
Home Values in the Area
Average Home Value in this Area
Tax History Compared to Growth
Tax History
| Year | Tax Paid | Tax Assessment Tax Assessment Total Assessment is a certain percentage of the fair market value that is determined by local assessors to be the total taxable value of land and additions on the property. | Land | Improvement |
|---|---|---|---|---|
| 2025 | $2,406 | $98,532 | $37,200 | $61,332 |
| 2024 | $2,406 | $109,713 | $37,080 | $72,633 |
| 2023 | $2,429 | $110,614 | $34,980 | $75,634 |
| 2022 | $2,243 | $95,700 | $27,984 | $67,716 |
| 2021 | $1,781 | $71,046 | $15,600 | $55,446 |
| 2020 | $1,962 | $74,776 | $10,440 | $64,336 |
| 2019 | $1,733 | $64,303 | $8,700 | $55,603 |
| 2018 | $1,500 | $59,783 | $5,700 | $54,083 |
| 2017 | $1,338 | $53,742 | $3,420 | $50,322 |
| 2016 | $1,235 | $49,599 | $3,420 | $46,179 |
| 2015 | $0 | $50,195 | $3,420 | $46,775 |
| 2014 | -- | $52,595 | $5,820 | $46,775 |
Source: Public Records
Map
Nearby Homes
- 120 N Colbert Ave
- 218 N Burdette Ave
- 306 S Dewey Ave
- 1821 E Pecan St
- 1709 E Chaffin St
- 212 N Harrison Ave
- 315 1/2 N Carr Ave
- 406 N Burdette Ave
- 417 N Burdette Ave
- 601 Hillside Dr
- 306 N Cleveland Ave
- 621 Hillside Dr
- 112 N Grand Ave
- 508 N Elliott St
- 1417 E Chaffin St
- 713 Hillside Dr
- 1503 E Wells Ave Unit 2
- 608 S Loving Ave
- 1431 E Wells Ave
- 506 N Grand Ave
- 1923 E Houston St
- 110 S Andrews Ave
- 101 N Burdette Ave
- 105 N Burdette Ave
- 118 N Andrews Ave
- 107 N Burdette Ave
- 100 S Andrews Ave
- 115 N Burdette Ave
- 120 N Andrews Ave
- 101 S Burdette Ave Unit 103
- 104 S Andrews Ave
- 119 N Burdette Ave
- 107 S Burdette Ave
- 122 N Andrews Ave
- 118 S Andrews Ave
- 121 N Burdette Ave
- 103 N Andrews Ave
- 105 N Andrews Ave
- 107 N Andrews Ave
- 119 N Andrews Ave