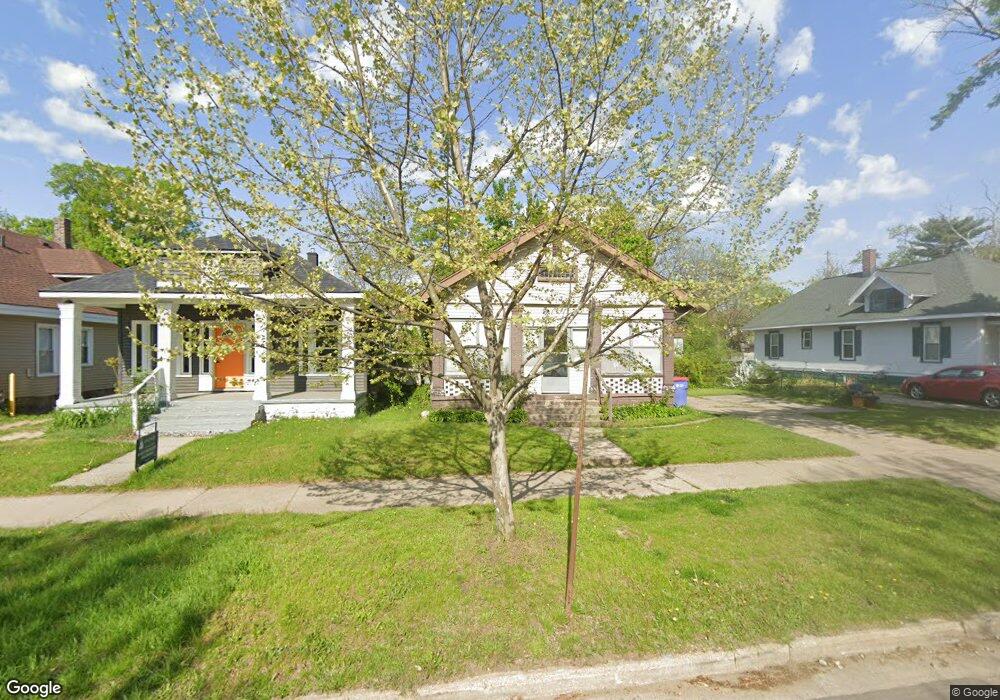
1917 Francis Ave SE Grand Rapids, MI 49507
Garfield Park NeighborhoodEstimated Value: $188,000 - $205,000
2
Beds
1
Bath
1,148
Sq Ft
$171/Sq Ft
Est. Value
About This Home
This home is located at 1917 Francis Ave SE, Grand Rapids, MI 49507 and is currently estimated at $196,691, approximately $171 per square foot. 1917 Francis Ave SE is a home located in Kent County with nearby schools including Dickinson Academy, Alger Middle School, and Ottawa Hills High School.
Ownership History
Date
Name
Owned For
Owner Type
Purchase Details
Closed on
Oct 12, 2012
Sold by
Rickets Jerry
Bought by
Pilgrim Homes Llc
Current Estimated Value
Purchase Details
Closed on
Jul 16, 2010
Sold by
Rock Investing Llc
Bought by
Ricketts Jerry
Purchase Details
Closed on
Jul 8, 2010
Sold by
Wells Fargo Bank Na
Bought by
Rock Investing Llc
Purchase Details
Closed on
Jan 9, 2008
Sold by
Johnson Joseph and Johnson Joann
Bought by
Wells Fargo Bank Na and Carrington Mortgage Loan Trust Series 20
Purchase Details
Closed on
Sep 29, 2006
Sold by
Moore B David and Moore Carolyn
Bought by
Johnson Joseph and Johnson Joann
Home Financials for this Owner
Home Financials are based on the most recent Mortgage that was taken out on this home.
Original Mortgage
$57,840
Interest Rate
9.4%
Mortgage Type
Purchase Money Mortgage
Purchase Details
Closed on
Apr 19, 1999
Sold by
Martin Martin B B and Martin Moore B
Bought by
Moore B and Pilgrim Homes Llc
Purchase Details
Closed on
Nov 25, 1987
Purchase Details
Closed on
May 14, 1987
Purchase Details
Closed on
Jan 21, 1987
Purchase Details
Closed on
May 31, 1984
Purchase Details
Closed on
Oct 20, 1983
Purchase Details
Closed on
Jul 29, 1983
Purchase Details
Closed on
May 20, 1983
Create a Home Valuation Report for This Property
The Home Valuation Report is an in-depth analysis detailing your home's value as well as a comparison with similar homes in the area
Home Values in the Area
Average Home Value in this Area
Purchase History
| Date | Buyer | Sale Price | Title Company |
|---|---|---|---|
| Pilgrim Homes Llc | $12,000 | None Available | |
| Ricketts Jerry | $18,000 | None Available | |
| Rock Investing Llc | $13,000 | None Available | |
| Wells Fargo Bank Na | $63,430 | None Available | |
| Johnson Joseph | $72,300 | None Available | |
| Moore B | $10,000 | -- | |
| -- | $24,500 | -- | |
| -- | $13,000 | -- | |
| -- | $100 | -- | |
| -- | $21,900 | -- | |
| -- | $13,000 | -- | |
| -- | -- | -- | |
| -- | -- | -- |
Source: Public Records
Mortgage History
| Date | Status | Borrower | Loan Amount |
|---|---|---|---|
| Previous Owner | Johnson Joseph | $57,840 |
Source: Public Records
Tax History Compared to Growth
Tax History
| Year | Tax Paid | Tax Assessment Tax Assessment Total Assessment is a certain percentage of the fair market value that is determined by local assessors to be the total taxable value of land and additions on the property. | Land | Improvement |
|---|---|---|---|---|
| 2025 | $1,286 | $85,200 | $0 | $0 |
| 2024 | $1,286 | $76,600 | $0 | $0 |
| 2023 | $1,275 | $66,400 | $0 | $0 |
| 2022 | $1,212 | $57,100 | $0 | $0 |
| 2021 | $1,181 | $48,000 | $0 | $0 |
| 2020 | $1,141 | $39,400 | $0 | $0 |
| 2019 | $1,133 | $33,100 | $0 | $0 |
| 2018 | $1,133 | $26,400 | $0 | $0 |
| 2017 | $1,105 | $21,800 | $0 | $0 |
| 2016 | $1,111 | $20,700 | $0 | $0 |
| 2015 | $1,058 | $20,700 | $0 | $0 |
| 2013 | -- | $23,800 | $0 | $0 |
Source: Public Records
Map
Nearby Homes
- 27 Rose St SW
- 2025 Francis Ave SE
- 100 Griggs St SW
- 140 Stewart St SW
- 46 Dickinson St SW
- 319 Griggs St SE
- 2154 Horton Ave SE
- 1163 Lafayette Ave SE
- 1661 Madison Ave SE
- 1718 Madison Ave SE
- 66 Sutton St SW
- 436 Storrs St SE
- 26 Banner St SW
- 362 Fox St SW
- 2123 Godwin Ave SE
- 2201 Darwin Ave SW
- 1828 Stafford Ave SW
- 325 Brown St SW
- 1805 Stafford Ave SW
- 2221 Palace Ave SW
- 1911 Francis Ave SE
- 1925 Francis Ave SE
- 1907 Francis Ave SE
- 1929 Francis Ave SE
- 1905 Francis Ave SE
- 1916 Horton Ave SE
- 1920 Horton Ave SE
- 1912 Horton Ave SE
- 1924 Horton Ave SE
- 1933 Francis Ave SE
- 1906 Horton Ave SE
- 1928 Horton Ave SE
- 1849 Francis Ave SE
- 1912 Francis Ave SE
- 1902 Horton Ave SE
- 1922 Francis Ave SE
- 1908 Francis Ave SE
- 1932 Horton Ave SE
- 1937 Francis Ave SE
- 1845 Francis Ave SE