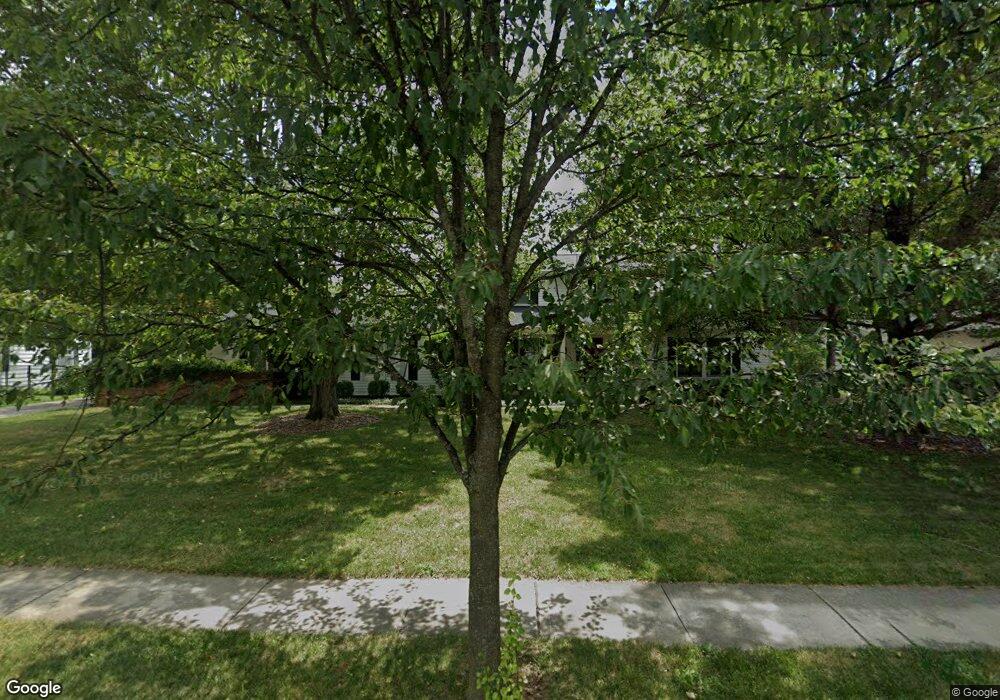
1917 Lytham Rd Columbus, OH 43220
Estimated Value: $945,000 - $1,130,393
5
Beds
6
Baths
4,857
Sq Ft
$213/Sq Ft
Est. Value
About This Home
This home is located at 1917 Lytham Rd, Columbus, OH 43220 and is currently estimated at $1,032,598, approximately $212 per square foot. 1917 Lytham Rd is a home located in Franklin County with nearby schools including Windermere Elementary School, Hastings Middle School, and Upper Arlington High School.
Ownership History
Date
Name
Owned For
Owner Type
Purchase Details
Closed on
Jan 20, 2022
Sold by
Buoni Theresa M
Bought by
Magill Jacqueline and Magill Michael
Current Estimated Value
Home Financials for this Owner
Home Financials are based on the most recent Mortgage that was taken out on this home.
Original Mortgage
$436,000
Outstanding Balance
$401,828
Interest Rate
3.11%
Mortgage Type
New Conventional
Estimated Equity
$630,770
Purchase Details
Closed on
Jul 4, 1998
Sold by
Corner Elizabeth J
Bought by
Buoni Theresa M
Home Financials for this Owner
Home Financials are based on the most recent Mortgage that was taken out on this home.
Original Mortgage
$200,000
Interest Rate
7.15%
Purchase Details
Closed on
Apr 29, 1998
Sold by
Corner Christopher J and Corner Barbara S Schneider
Bought by
Corner Elizabeth J
Create a Home Valuation Report for This Property
The Home Valuation Report is an in-depth analysis detailing your home's value as well as a comparison with similar homes in the area
Home Values in the Area
Average Home Value in this Area
Purchase History
| Date | Buyer | Sale Price | Title Company |
|---|---|---|---|
| Magill Jacqueline | $766,000 | New Title Company Name | |
| Buoni Theresa M | $385,000 | Chicago Title West | |
| Corner Elizabeth J | -- | -- |
Source: Public Records
Mortgage History
| Date | Status | Borrower | Loan Amount |
|---|---|---|---|
| Open | Magill Jacqueline | $436,000 | |
| Previous Owner | Buoni Theresa M | $200,000 |
Source: Public Records
Tax History Compared to Growth
Tax History
| Year | Tax Paid | Tax Assessment Tax Assessment Total Assessment is a certain percentage of the fair market value that is determined by local assessors to be the total taxable value of land and additions on the property. | Land | Improvement |
|---|---|---|---|---|
| 2024 | $16,062 | $277,450 | $81,940 | $195,510 |
| 2023 | $15,863 | $277,445 | $81,935 | $195,510 |
| 2022 | $16,759 | $239,830 | $70,880 | $168,950 |
| 2021 | $14,835 | $239,830 | $70,880 | $168,950 |
| 2020 | $14,704 | $239,830 | $70,880 | $168,950 |
| 2019 | $13,565 | $195,620 | $70,880 | $124,740 |
| 2018 | $12,952 | $195,620 | $70,880 | $124,740 |
| 2017 | $12,944 | $195,620 | $70,880 | $124,740 |
| 2016 | $12,427 | $187,950 | $38,990 | $148,960 |
| 2015 | $12,416 | $187,950 | $38,990 | $148,960 |
| 2014 | $12,430 | $187,950 | $38,990 | $148,960 |
| 2013 | $5,936 | $170,870 | $35,455 | $135,415 |
Source: Public Records
Map
Nearby Homes
- 3804 Mountview Rd
- 3701 Reed Rd
- 4115 Woodbridge Rd
- 3600 Reed Rd Unit 15
- 2276 Johnston Rd
- 2276 Hoxton Ct
- 2081 Fishinger Rd
- 4094 Lyon Dr
- 2300 Hoxton Ct
- 3918 Hillview Dr
- 3509 Redding Rd
- 2195 Edgevale Rd
- 2162 Oakmount Rd
- 3920 Overdale Dr
- 1501 Bridgeton Dr
- 2308 Shrewsbury Rd
- 2413 Edgevale Rd
- 1767 Riverhill Rd
- 2401 Shrewsbury Rd
- 3444 Sunningdale Way
- 1905 Lytham Rd
- 1929 Lytham Rd
- 3930 Newhall Rd
- 1941 Lytham Rd
- 3921 Lytham Ct
- 1953 Lytham Rd
- 3942 Newhall Rd
- 3931 Newhall Rd
- 3933 Lytham Ct
- 3945 Newhall Rd
- 1965 Lytham Rd
- 3920 Lytham Ct
- 3954 Newhall Rd
- 1960 Lytham Rd
- 3939 Lytham Ct
- 3945 Lytham Ct
- 3930 Lytham Ct
- 3957 Newhall Rd
- 3950 Fenwick Rd
- 1977 Lytham Rd