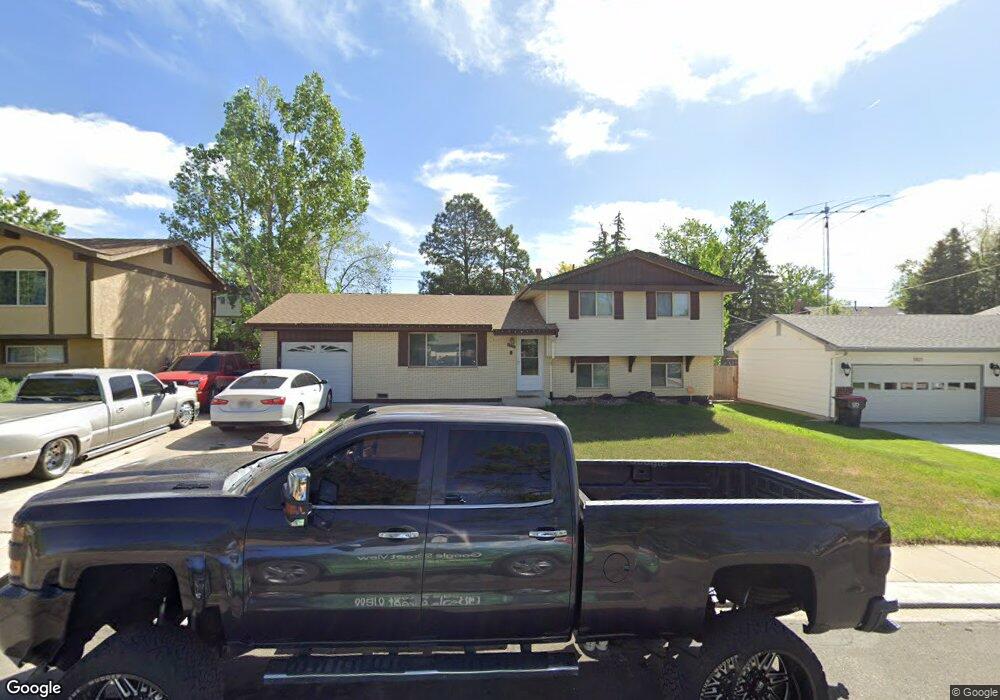
1917 Montezuma Dr Colorado Springs, CO 80910
Pikes Peak Park NeighborhoodEstimated Value: $343,000 - $400,000
4
Beds
3
Baths
1,107
Sq Ft
$334/Sq Ft
Est. Value
About This Home
This home is located at 1917 Montezuma Dr, Colorado Springs, CO 80910 and is currently estimated at $369,719, approximately $333 per square foot. 1917 Montezuma Dr is a home located in El Paso County with nearby schools including Monterey Elementary School, Carmel Middle School, and Harrison High School.
Ownership History
Date
Name
Owned For
Owner Type
Purchase Details
Closed on
May 9, 2019
Sold by
Coleman Theresa A
Bought by
Rios Ivan U
Current Estimated Value
Home Financials for this Owner
Home Financials are based on the most recent Mortgage that was taken out on this home.
Original Mortgage
$252,289
Outstanding Balance
$220,678
Interest Rate
3.95%
Mortgage Type
FHA
Estimated Equity
$149,041
Purchase Details
Closed on
Sep 5, 2017
Sold by
Coleman Theresa Ann
Bought by
Coleman Theresa A and The Theresa A Coleman Trust
Purchase Details
Closed on
Nov 24, 1997
Sold by
Leavitt Donald E
Bought by
Coleman Theresa Ann
Home Financials for this Owner
Home Financials are based on the most recent Mortgage that was taken out on this home.
Original Mortgage
$97,250
Interest Rate
7.31%
Mortgage Type
VA
Purchase Details
Closed on
Feb 29, 1988
Bought by
Coleman Theresa A Trustee
Create a Home Valuation Report for This Property
The Home Valuation Report is an in-depth analysis detailing your home's value as well as a comparison with similar homes in the area
Home Values in the Area
Average Home Value in this Area
Purchase History
| Date | Buyer | Sale Price | Title Company |
|---|---|---|---|
| Rios Ivan U | $261,000 | Unified Title Company | |
| Coleman Theresa A | -- | None Available | |
| Coleman Theresa Ann | $95,350 | Security Title | |
| Coleman Theresa A Trustee | -- | -- |
Source: Public Records
Mortgage History
| Date | Status | Borrower | Loan Amount |
|---|---|---|---|
| Open | Rios Ivan U | $252,289 | |
| Previous Owner | Coleman Theresa Ann | $97,250 |
Source: Public Records
Tax History Compared to Growth
Tax History
| Year | Tax Paid | Tax Assessment Tax Assessment Total Assessment is a certain percentage of the fair market value that is determined by local assessors to be the total taxable value of land and additions on the property. | Land | Improvement |
|---|---|---|---|---|
| 2025 | $1,319 | $25,910 | -- | -- |
| 2024 | $1,034 | $26,450 | $3,570 | $22,880 |
| 2022 | $1,019 | $18,900 | $2,780 | $16,120 |
| 2021 | $1,088 | $19,440 | $2,860 | $16,580 |
| 2020 | $1,158 | $17,770 | $2,150 | $15,620 |
| 2019 | $838 | $13,270 | $2,150 | $11,120 |
| 2018 | $677 | $10,320 | $1,620 | $8,700 |
| 2017 | $517 | $10,320 | $1,620 | $8,700 |
| 2016 | $539 | $10,100 | $1,670 | $8,430 |
| 2015 | $539 | $10,100 | $1,670 | $8,430 |
| 2014 | $545 | $10,100 | $1,670 | $8,430 |
Source: Public Records
Map
Nearby Homes
- 1915 Ventura Dr
- 1998 Ventura Dr
- 2014 Olympic Dr
- 2003 Del Mar Dr
- 2909 Del Mar Cir
- 2004 Monterey Rd
- 1836 Del Mar Dr
- 1879 Monterey Rd
- 2918 Del Mar Cir
- 2123 Fernwood Dr
- 2123 Kodiak Dr
- 2114 Pepperwood Dr
- 1948 Carmel Dr
- 1519 Saratoga Dr
- 2184 Whitewood Dr
- 1922 Saratoga Dr
- 1619 Shasta Dr
- 2236 Fernwood Dr
- 1631 Shasta Dr
- 2722 Tumblewood Grove
- 1921 Montezuma Dr
- 1913 Montezuma Dr
- 1914 Kodiak Dr
- 1910 Kodiak Dr
- 1922 Kodiak Dr
- 1907 Montezuma Dr
- 1925 Montezuma Dr
- 1906 Kodiak Dr
- 1918 Montezuma Dr
- 1914 Montezuma Dr
- 1926 Kodiak Dr
- 1922 Montezuma Dr
- 1910 Montezuma Dr
- 1817 Carmel Dr
- 1903 Montezuma Dr
- 1929 Montezuma Dr
- 1926 Montezuma Dr
- 1930 Kodiak Dr
- 1906 Montezuma Dr
- 1919 Capulin Dr