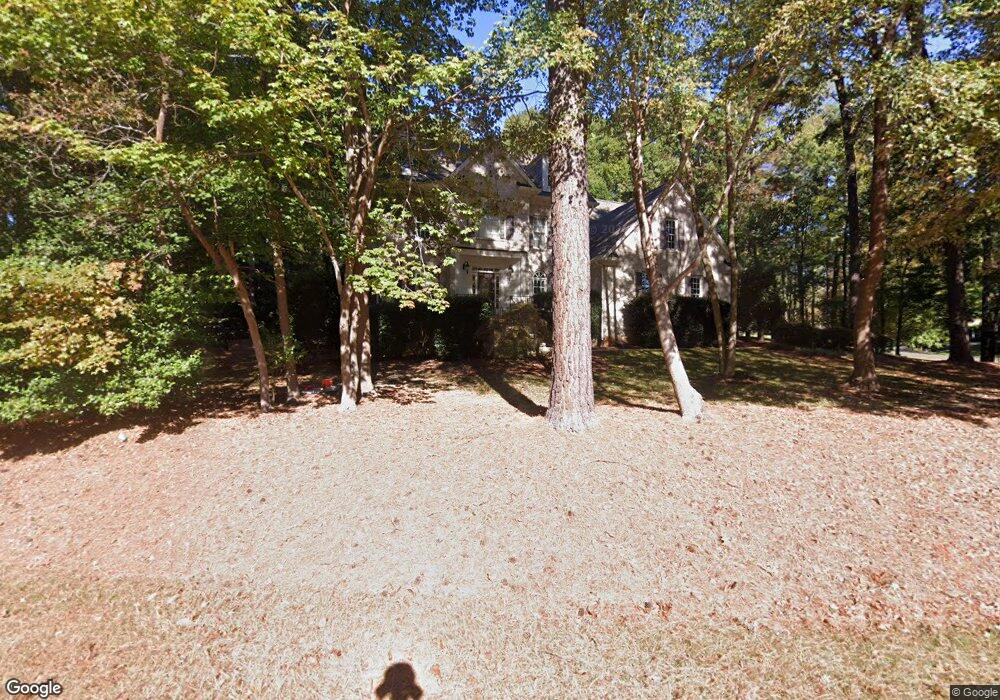
1917 Pleasant Forest Way Wake Forest, NC 27587
Falls Lake NeighborhoodEstimated Value: $852,232 - $970,000
--
Bed
4
Baths
3,503
Sq Ft
$255/Sq Ft
Est. Value
About This Home
This home is located at 1917 Pleasant Forest Way, Wake Forest, NC 27587 and is currently estimated at $892,308, approximately $254 per square foot. 1917 Pleasant Forest Way is a home located in Wake County with nearby schools including North Forest Pines Elementary School, Wake Forest-Rolesville Middle School, and Wake Forest High School.
Ownership History
Date
Name
Owned For
Owner Type
Purchase Details
Closed on
Jul 25, 2024
Sold by
Waybright Bradley C
Bought by
Martin Chrstine L and Martin Kathryn Rae
Current Estimated Value
Home Financials for this Owner
Home Financials are based on the most recent Mortgage that was taken out on this home.
Original Mortgage
$733,500
Outstanding Balance
$724,672
Interest Rate
6.95%
Mortgage Type
New Conventional
Estimated Equity
$167,636
Purchase Details
Closed on
Nov 30, 2004
Sold by
Houseman Custom Homes Inc
Bought by
Waybright Bradley C and Waybright Elisabeth C
Home Financials for this Owner
Home Financials are based on the most recent Mortgage that was taken out on this home.
Original Mortgage
$328,000
Interest Rate
5.66%
Mortgage Type
Purchase Money Mortgage
Create a Home Valuation Report for This Property
The Home Valuation Report is an in-depth analysis detailing your home's value as well as a comparison with similar homes in the area
Home Values in the Area
Average Home Value in this Area
Purchase History
| Date | Buyer | Sale Price | Title Company |
|---|---|---|---|
| Martin Chrstine L | $815,000 | None Listed On Document | |
| Waybright Bradley C | $508,000 | -- |
Source: Public Records
Mortgage History
| Date | Status | Borrower | Loan Amount |
|---|---|---|---|
| Open | Martin Chrstine L | $733,500 | |
| Previous Owner | Waybright Bradley C | $328,000 |
Source: Public Records
Tax History Compared to Growth
Tax History
| Year | Tax Paid | Tax Assessment Tax Assessment Total Assessment is a certain percentage of the fair market value that is determined by local assessors to be the total taxable value of land and additions on the property. | Land | Improvement |
|---|---|---|---|---|
| 2025 | $5,269 | $820,616 | $130,000 | $690,616 |
| 2024 | $5,116 | $820,616 | $130,000 | $690,616 |
| 2023 | $4,028 | $514,003 | $116,000 | $398,003 |
| 2022 | $3,732 | $514,003 | $116,000 | $398,003 |
| 2021 | $3,632 | $514,003 | $116,000 | $398,003 |
| 2020 | $3,572 | $514,003 | $116,000 | $398,003 |
| 2019 | $3,901 | $475,211 | $80,000 | $395,211 |
| 2018 | $3,586 | $475,211 | $80,000 | $395,211 |
| 2017 | $3,399 | $475,211 | $80,000 | $395,211 |
| 2016 | $3,330 | $475,211 | $80,000 | $395,211 |
| 2015 | $4,253 | $609,503 | $118,000 | $491,503 |
| 2014 | $4,031 | $609,503 | $118,000 | $491,503 |
Source: Public Records
Map
Nearby Homes
- 2040 Pleasant Forest Way
- 8413 Portmarnock Ct
- 2305 Berteau Dr
- 8717 Holstein Ct
- 8920 Thompson Mill Rd
- 8912 Thompson Mill Rd
- 8916 Thompson Mill Rd
- 2405 Welsh Tavern Way
- 7417 Dover Hills Dr
- 2420 Mollynick Ln
- 2425 Welsh Tavern Way
- 2005 Shingleback Dr
- 14212 Careme Ct
- 3000 Vidal Ct
- 12708 Shephards Landing Dr
- 3000 Damson Ct
- 12705 Shephards Landing Dr
- 3005 Domaine Dr
- 2637 Trifle Ln
- 8616 Sunflower Meadows Ln
- 7205 Donneeford Rd
- 7213 Donneeford Rd
- 1909 Pleasant Forest Way
- 1909 Pleasant Forest Way Unit 2
- 1916 Pleasant Forest Way
- 2076 Pleasant Forest Way
- 1901 Pleasant Forest Way
- 1908 Pleasant Forest Way
- 1908 Pleasant Forest Way Unit 2
- 1901 Pleasant Forest Way Unit 2
- 7204 Donneeford Rd
- 1905 Pleasant Forest Way
- 7208 Donneeford Rd
- 7112 Anglesey Ct
- 7112 Anglesey Ct
- 7112 Anglesey Ct
- 7217 Donneeford Rd
- 7117 Anglesey Ct
- 7216 Donneeford Rd
- 7220 Donneeford Rd