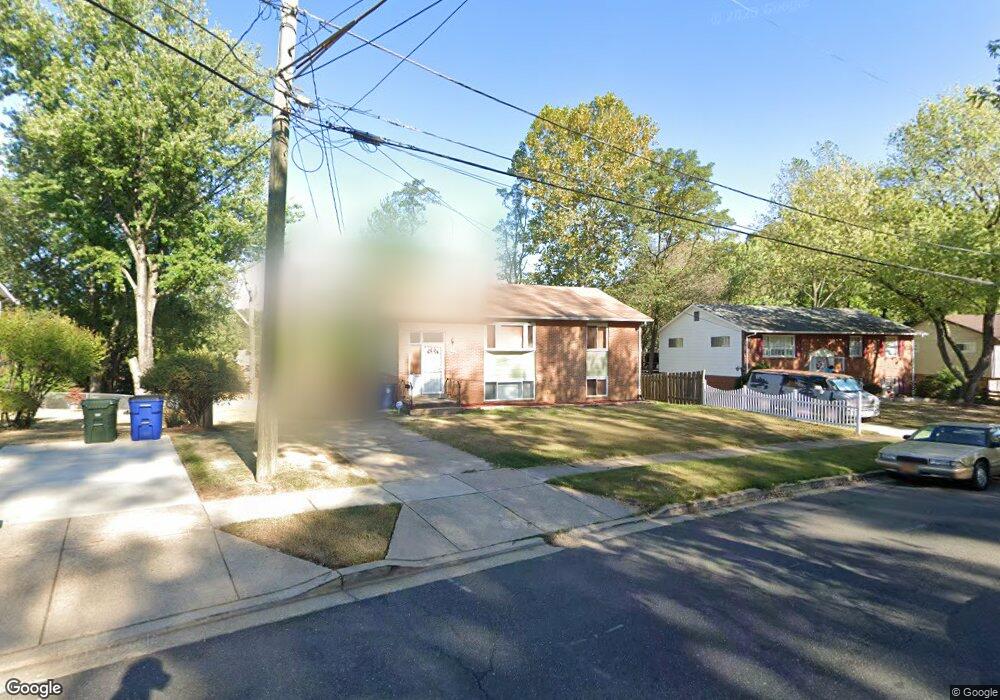
1918 Brewton St District Heights, MD 20747
Estimated Value: $378,000 - $416,000
4
Beds
2
Baths
1,064
Sq Ft
$370/Sq Ft
Est. Value
About This Home
This home is located at 1918 Brewton St, District Heights, MD 20747 and is currently estimated at $393,520, approximately $369 per square foot. 1918 Brewton St is a home located in Prince George's County with nearby schools including North Forestville Elementary School, Walker Mill Middle School, and Dr. Henry A. Wise Jr. High School.
Ownership History
Date
Name
Owned For
Owner Type
Purchase Details
Closed on
Oct 19, 2011
Sold by
Saint Andrews Associates Inc
Bought by
Sullivan Janet
Current Estimated Value
Home Financials for this Owner
Home Financials are based on the most recent Mortgage that was taken out on this home.
Original Mortgage
$165,592
Outstanding Balance
$113,754
Interest Rate
4.25%
Mortgage Type
FHA
Estimated Equity
$279,766
Purchase Details
Closed on
Apr 15, 2011
Sold by
Ray Barbara
Bought by
Saint Andrews Associates Inc
Purchase Details
Closed on
Nov 19, 2010
Sold by
Ray Barbara
Bought by
Saint Andrews Associates Inc
Purchase Details
Closed on
Jun 2, 2000
Sold by
Conti Mortgage Corp
Bought by
Ray Barbara
Purchase Details
Closed on
Jul 30, 1999
Sold by
Kerr William C and Kerr Francina
Bought by
Conti Mortgage Corp
Create a Home Valuation Report for This Property
The Home Valuation Report is an in-depth analysis detailing your home's value as well as a comparison with similar homes in the area
Home Values in the Area
Average Home Value in this Area
Purchase History
| Date | Buyer | Sale Price | Title Company |
|---|---|---|---|
| Sullivan Janet | $169,900 | Sheridan Title Inc | |
| Saint Andrews Associates Inc | $105,000 | -- | |
| Saint Andrews Associates Inc | $105,000 | -- | |
| Ray Barbara | $118,000 | -- | |
| Conti Mortgage Corp | $107,550 | -- |
Source: Public Records
Mortgage History
| Date | Status | Borrower | Loan Amount |
|---|---|---|---|
| Open | Sullivan Janet | $165,592 |
Source: Public Records
Tax History
| Year | Tax Paid | Tax Assessment Tax Assessment Total Assessment is a certain percentage of the fair market value that is determined by local assessors to be the total taxable value of land and additions on the property. | Land | Improvement |
|---|---|---|---|---|
| 2025 | $4,877 | $322,133 | -- | -- |
| 2024 | $4,877 | $298,567 | -- | -- |
| 2023 | $3,649 | $275,000 | $61,100 | $213,900 |
| 2022 | $4,349 | $261,667 | $0 | $0 |
| 2021 | $4,188 | $248,333 | $0 | $0 |
| 2020 | $4,093 | $235,000 | $60,500 | $174,500 |
| 2019 | $4,101 | $228,600 | $0 | $0 |
| 2018 | $4,031 | $222,200 | $0 | $0 |
| 2017 | $3,827 | $215,800 | $0 | $0 |
| 2016 | -- | $195,367 | $0 | $0 |
| 2015 | $4,541 | $174,933 | $0 | $0 |
| 2014 | $4,541 | $154,500 | $0 | $0 |
Source: Public Records
Map
Nearby Homes
- 1400 Waterford Dr
- 1408 Shady Glen Dr
- 1815 Gould Dr
- 7244 Flag Harbor Dr
- 7102 Starboard Dr
- 2308 Senator Ave
- 1713 Gould Dr
- 2501 Kirtland Ave
- 2410 Ritchie Rd
- 7007 Marbury Ct
- 1303 Fairfield Dr
- 7304 Malden Ln
- 2206 Ramblewood Dr
- 6909 Bank Run Terrace
- 1733 Addison Rd S Unit 1733
- 1705 Addison Rd S
- 6807 Elmhurst St
- 1891 Addison Rd S
- 6745 Milltown Ct
- 2703 Overdale Place
- 1920 Brewton St
- 1916 Brewton St
- 7700 Anny Dr
- 1922 Brewton St
- 1919 Brewton St
- 7702 Anny Dr
- 7701 Anny Dr
- 1921 Brewton St
- 1802 Brewton Ct
- 1917 Brewton St
- 1924 Brewton St
- 1923 Brewton St
- 7703 Anny Dr
- 1807 Brewton Ct
- 7704 Anny Dr
- 1915 Brewton St
- 7703 Berry Place
- 2000 Brewton St
- 1800 Brewton Ct
- 1900 Wintergreen Ct
Your Personal Tour Guide
Ask me questions while you tour the home.