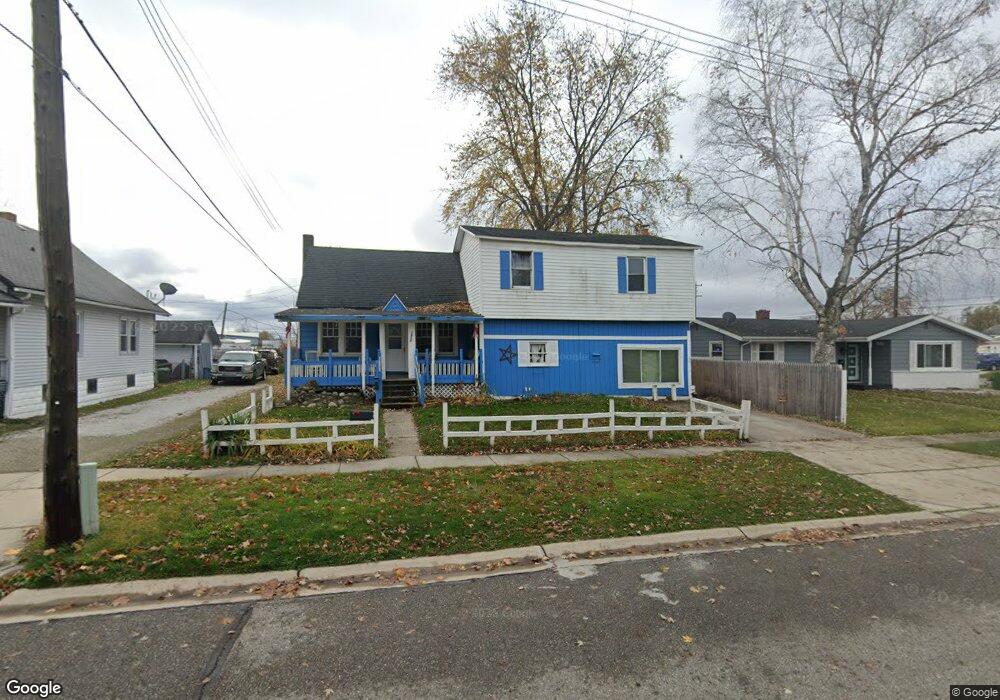
1918 Minnie St Port Huron, MI 48060
Estimated Value: $44,000 - $148,000
4
Beds
3
Baths
2,150
Sq Ft
$46/Sq Ft
Est. Value
About This Home
This home is located at 1918 Minnie St, Port Huron, MI 48060 and is currently estimated at $98,108, approximately $45 per square foot. 1918 Minnie St is a home located in St. Clair County with nearby schools including Michigamme Elementary School, Central Middle School, and Port Huron High School.
Ownership History
Date
Name
Owned For
Owner Type
Purchase Details
Closed on
Jul 16, 2025
Sold by
Investcor Llc
Bought by
Bp Properties Llc
Current Estimated Value
Purchase Details
Closed on
Oct 1, 2024
Sold by
Investcor Llc
Bought by
Bp Properties Llc
Purchase Details
Closed on
Sep 30, 2024
Sold by
Lagriff Homes Llc
Bought by
Investcor Llc
Purchase Details
Closed on
May 18, 2023
Sold by
Sheriff Of St Clair County
Bought by
Lagriff Homes Llc
Purchase Details
Closed on
Jul 3, 2018
Sold by
David Meldrum Charles
Bought by
Meldrum Robyn
Create a Home Valuation Report for This Property
The Home Valuation Report is an in-depth analysis detailing your home's value as well as a comparison with similar homes in the area
Home Values in the Area
Average Home Value in this Area
Purchase History
| Date | Buyer | Sale Price | Title Company |
|---|---|---|---|
| Bp Properties Llc | $45,000 | None Listed On Document | |
| Bp Properties Llc | -- | None Listed On Document | |
| Investcor Llc | -- | None Listed On Document | |
| Lagriff Homes Llc | $31,588 | None Listed On Document | |
| Meldrum Robyn | -- | None Listed On Document |
Source: Public Records
Tax History Compared to Growth
Tax History
| Year | Tax Paid | Tax Assessment Tax Assessment Total Assessment is a certain percentage of the fair market value that is determined by local assessors to be the total taxable value of land and additions on the property. | Land | Improvement |
|---|---|---|---|---|
| 2025 | $1,969 | $48,500 | $0 | $0 |
| 2024 | $1,708 | $72,900 | $0 | $0 |
| 2023 | $1,138 | $65,000 | $0 | $0 |
| 2022 | $1,145 | $49,400 | $0 | $0 |
| 2021 | $1,088 | $41,000 | $0 | $0 |
| 2020 | $1,100 | $35,800 | $35,800 | $0 |
| 2019 | $1,081 | $23,700 | $0 | $0 |
| 2018 | $1,057 | $23,700 | $0 | $0 |
| 2017 | $945 | $22,300 | $0 | $0 |
| 2016 | $800 | $22,300 | $0 | $0 |
| 2015 | $832 | $22,300 | $22,300 | $0 |
| 2014 | $832 | $23,200 | $23,200 | $0 |
| 2013 | -- | $25,300 | $0 | $0 |
Source: Public Records
Map
Nearby Homes