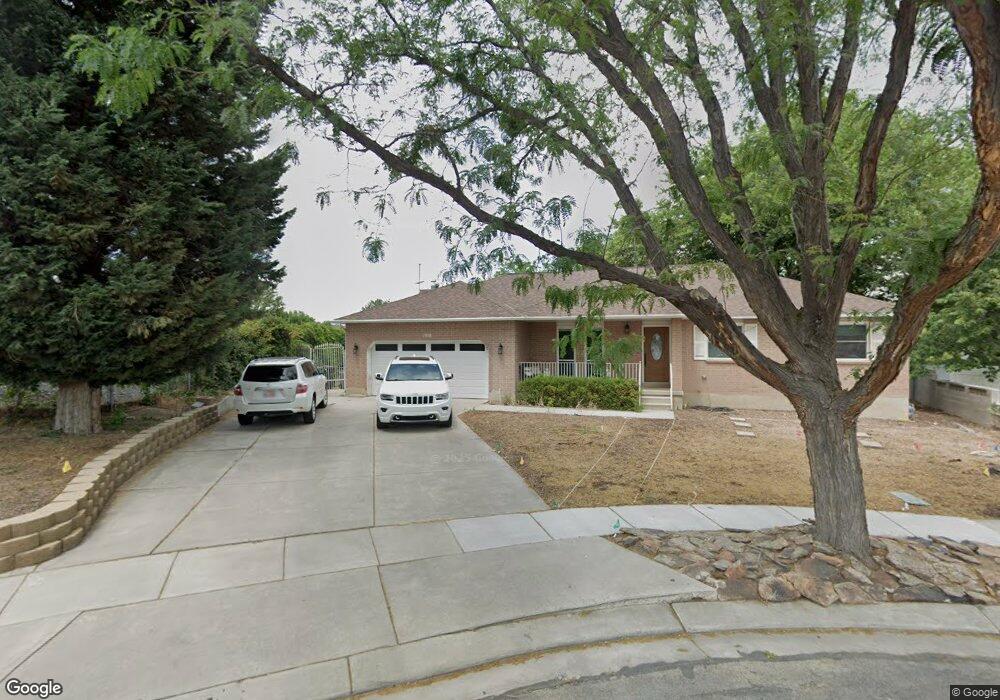
1918 Peach Tree Cir South Jordan, UT 84095
Estimated Value: $611,000 - $651,483
5
Beds
3
Baths
3,000
Sq Ft
$212/Sq Ft
Est. Value
About This Home
This home is located at 1918 Peach Tree Cir, South Jordan, UT 84095 and is currently estimated at $636,371, approximately $212 per square foot. 1918 Peach Tree Cir is a home located in Salt Lake County with nearby schools including Jordan Ridge School, South Jordan Middle School, and Hawthorn Academy.
Ownership History
Date
Name
Owned For
Owner Type
Purchase Details
Closed on
Sep 9, 2025
Sold by
Hendricksen Carl W and Hendricksen Lara
Bought by
Carl And Lara Hendricksen Living Trust and Hendricksen
Current Estimated Value
Purchase Details
Closed on
Jan 9, 2009
Sold by
Hendricksen Carl W and Hendricksen Lara
Bought by
Hendricksen Carl W and Hendricksen Lara
Home Financials for this Owner
Home Financials are based on the most recent Mortgage that was taken out on this home.
Original Mortgage
$286,426
Interest Rate
5.14%
Mortgage Type
FHA
Purchase Details
Closed on
Aug 23, 2005
Sold by
Squire Lee O
Bought by
Hendricksen Carl W and Vanausdale Lara
Home Financials for this Owner
Home Financials are based on the most recent Mortgage that was taken out on this home.
Original Mortgage
$236,241
Interest Rate
5.61%
Mortgage Type
FHA
Purchase Details
Closed on
Jan 13, 2005
Sold by
Squire Lee O and Squire Bobbie N
Bought by
Squire Lee O and Squire Bobbie N
Purchase Details
Closed on
Jan 19, 1994
Sold by
Squire Lee
Bought by
Squire Lee O and Squire Bobbie N
Purchase Details
Closed on
Jan 4, 1994
Sold by
Powell Gene M and Powell Larry J
Bought by
Squire Lee O
Create a Home Valuation Report for This Property
The Home Valuation Report is an in-depth analysis detailing your home's value as well as a comparison with similar homes in the area
Home Values in the Area
Average Home Value in this Area
Purchase History
| Date | Buyer | Sale Price | Title Company |
|---|---|---|---|
| Carl And Lara Hendricksen Living Trust | -- | None Listed On Document | |
| Hendricksen Carl W | -- | First American Title Park Ci | |
| Hendricksen Carl W | -- | First American Title | |
| Squire Lee O | -- | Advantage Title Co | |
| Squire Lee O | -- | Advantage Title Co | |
| Squire Lee O | -- | -- | |
| Squire Lee O | $250 | -- |
Source: Public Records
Mortgage History
| Date | Status | Borrower | Loan Amount |
|---|---|---|---|
| Previous Owner | Hendricksen Carl W | $286,426 | |
| Previous Owner | Hendricksen Carl W | $236,241 |
Source: Public Records
Tax History Compared to Growth
Tax History
| Year | Tax Paid | Tax Assessment Tax Assessment Total Assessment is a certain percentage of the fair market value that is determined by local assessors to be the total taxable value of land and additions on the property. | Land | Improvement |
|---|---|---|---|---|
| 2025 | $2,977 | $585,300 | $218,900 | $366,400 |
| 2024 | $2,977 | $565,200 | $211,900 | $353,300 |
| 2023 | $2,977 | $544,900 | $199,900 | $345,000 |
| 2022 | $3,174 | $557,300 | $196,000 | $361,300 |
| 2021 | $2,613 | $421,000 | $131,600 | $289,400 |
| 2020 | $2,438 | $368,100 | $131,600 | $236,500 |
| 2019 | $2,406 | $357,100 | $124,100 | $233,000 |
| 2018 | $2,273 | $335,700 | $124,100 | $211,600 |
| 2017 | $2,068 | $299,400 | $124,100 | $175,300 |
| 2016 | $2,009 | $275,500 | $124,100 | $151,400 |
| 2015 | $2,101 | $280,200 | $158,500 | $121,700 |
| 2014 | $2,018 | $264,500 | $151,100 | $113,400 |
Source: Public Records
Map
Nearby Homes
- 1891 Orchard View Cir
- 1788 W Ikaros Ln
- 1767 W Ikaros Ln
- 1718 W Thira Ln
- 1741 W Nikos Ln
- 2246 Country Bend Dr Unit 25
- 9635 S 1600 W
- 9496 S 1930 W
- 1719 W Brocious Way Unit 301
- 9511 S Tirado Cove Unit 204
- 9909 Reunion Glen Way
- 1556 W Cornerstone Dr
- 2375 Bonanza Way
- 1596 W Cornerstone Way
- 1753 Rylie Ann Cir
- 9909 W Reunion Ave
- 2439 Bridle Oak Dr
- 9414 S 1980 W
- 1456 W Cornerstone Dr
- 2097 Jordan Villa Dr
- 1906 W Peach Tree Cir
- 1906 Peach Tree Cir
- 1907 W Town Meadows Ct
- 9843 S Brinly Ct
- 9843 S Brinly Ct Unit 3
- 1903 Peach Tree Cir
- 1897 W Town Meadows Ct
- 1897 Town Meadows Ct
- 9844 S Brinly Ct
- 9844 S Brinly Ct Unit 4
- 1886 Peach Tree Cir
- 1886 W Peach Tree Cir
- 1923 W 9800 S
- 9873 S Spruce Grove Way
- 9873 Spruce Grove Way
- 9827 S Brinly Ct
- 9827 S Brinly Ct Unit 2
- 1908 W Town Meadows Ct
- 1908 Town Meadows Ct
- 1883 W Peach Tree Cir