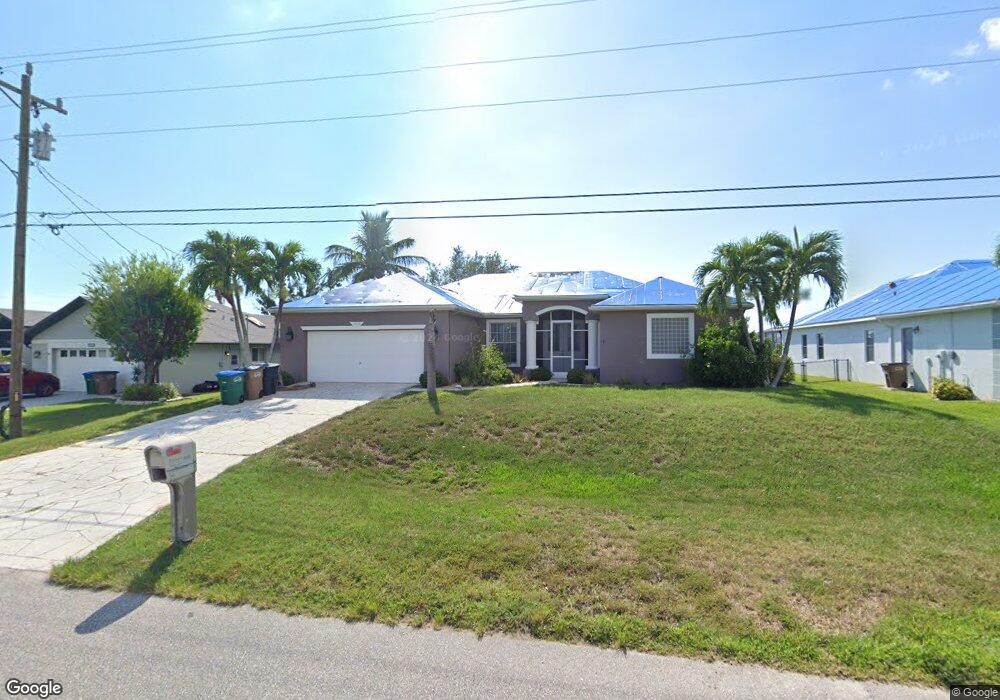
1918 SW 15th Ave Unit 57 Cape Coral, FL 33991
Trafalgar NeighborhoodEstimated Value: $477,000 - $502,000
4
Beds
3
Baths
2,890
Sq Ft
$171/Sq Ft
Est. Value
About This Home
This home is located at 1918 SW 15th Ave Unit 57, Cape Coral, FL 33991 and is currently estimated at $493,225, approximately $170 per square foot. 1918 SW 15th Ave Unit 57 is a home located in Lee County with nearby schools including Caloosa Elementary School, Cape Elementary School, and Tropic Isles Elementary School.
Ownership History
Date
Name
Owned For
Owner Type
Purchase Details
Closed on
Jan 19, 2021
Sold by
Meisenzahl Mark and Cummings Myranda
Bought by
Meisenzahl Mark
Current Estimated Value
Purchase Details
Closed on
Apr 15, 2019
Sold by
Jorn Lester J and Jorn Monica E
Bought by
Meisenzahl Mark and Cummings Myranda
Home Financials for this Owner
Home Financials are based on the most recent Mortgage that was taken out on this home.
Original Mortgage
$342,000
Interest Rate
4.4%
Mortgage Type
New Conventional
Purchase Details
Closed on
May 7, 2018
Sold by
Shuler Patrick A and Shuler Kimberly
Bought by
Jorn Lester J and Jorn Monica E
Home Financials for this Owner
Home Financials are based on the most recent Mortgage that was taken out on this home.
Original Mortgage
$273,600
Interest Rate
4.44%
Mortgage Type
New Conventional
Purchase Details
Closed on
Mar 19, 2002
Sold by
Truuvert Maret and Truuvert Antoni
Bought by
Shuler Patrick A
Create a Home Valuation Report for This Property
The Home Valuation Report is an in-depth analysis detailing your home's value as well as a comparison with similar homes in the area
Home Values in the Area
Average Home Value in this Area
Purchase History
| Date | Buyer | Sale Price | Title Company |
|---|---|---|---|
| Meisenzahl Mark | $4,500 | None Available | |
| Meisenzahl Mark | $360,000 | Assured Title Services Llc | |
| Jorn Lester J | $342,000 | First Internaitonal Title | |
| Shuler Patrick A | $10,000 | -- |
Source: Public Records
Mortgage History
| Date | Status | Borrower | Loan Amount |
|---|---|---|---|
| Previous Owner | Meisenzahl Mark | $342,000 | |
| Previous Owner | Jorn Lester J | $273,600 |
Source: Public Records
Tax History Compared to Growth
Tax History
| Year | Tax Paid | Tax Assessment Tax Assessment Total Assessment is a certain percentage of the fair market value that is determined by local assessors to be the total taxable value of land and additions on the property. | Land | Improvement |
|---|---|---|---|---|
| 2025 | $4,901 | $301,983 | -- | -- |
| 2024 | $4,901 | $293,472 | -- | -- |
| 2023 | $4,748 | $284,924 | $0 | $0 |
| 2022 | $4,462 | $276,625 | $0 | $0 |
| 2021 | $4,595 | $292,256 | $27,713 | $264,543 |
| 2020 | $4,671 | $264,860 | $25,000 | $239,860 |
| 2019 | $4,562 | $260,813 | $19,000 | $241,813 |
| 2018 | $5,144 | $246,272 | $19,000 | $227,272 |
| 2017 | $2,997 | $168,978 | $0 | $0 |
| 2016 | $2,924 | $230,667 | $19,703 | $210,964 |
| 2015 | $2,939 | $205,104 | $17,318 | $187,786 |
| 2014 | $2,911 | $205,604 | $16,590 | $189,014 |
| 2013 | -- | $185,712 | $15,820 | $169,892 |
Source: Public Records
Map
Nearby Homes
- 2007 SW 15th Place
- 1914 SW 15th Place
- 1906 SW 15th Place
- 1310 SW 19th Ln
- 1826 SW 15th Place
- 1025 SW 18th Terrace
- 1217 SW 20th St
- 1806 SW 15th Ave
- 1601 SW 19th St
- 1726 SW 15th Ave
- 428 SW 18th St
- 9 SW 22nd St
- 1708 SW 17th Ave
- 2106 SW 17th Ave
- 1705 SW 15th Ave
- 2213 SW 15th Ave
- 2103 SW 17th Place
- 2111 SW 17th Place
- 2227 SW 15th Place
- 2214 SW 14th Ave
- 1914 SW 15th Ave
- 1922 SW 15th Ave
- 1421 SW 19th Ln
- 1926 SW 15th Ave
- 1913 SW 15th Ave
- 1915 SW 15th Place
- 1911 SW 15th Place Unit 63
- 1417 SW 19th Ln
- 1909 SW 15th Ave
- 1930 SW 15th Ave
- 1422 SW 19th Ln
- 1906 SW 15th Ave
- 1905 SW 15th Ave
- 1418 SW 19th Ln
- 1413 SW 19th Ln
- 1934 SW 15th Ave
- 1910 SW 15th Place Unit 1912
- 1910 SW 15th Place
- 1423 SW 20th St
- 1836 SW 15th Ave