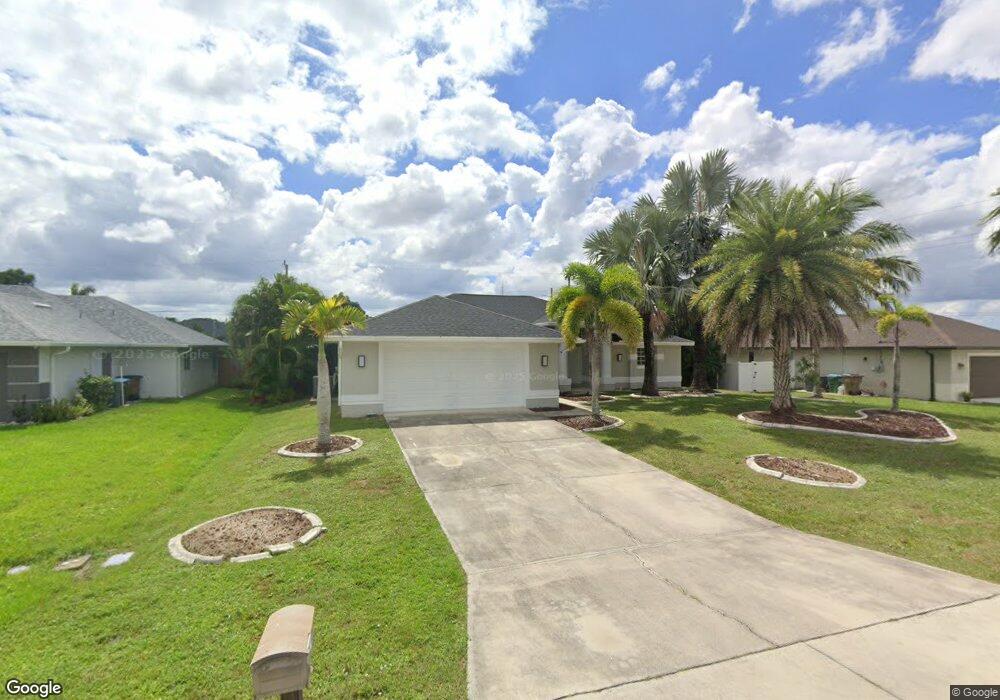
1918 SW 29th Terrace Cape Coral, FL 33914
Pelican NeighborhoodEstimated Value: $274,000 - $398,765
4
Beds
3
Baths
2,118
Sq Ft
$160/Sq Ft
Est. Value
About This Home
This home is located at 1918 SW 29th Terrace, Cape Coral, FL 33914 and is currently estimated at $338,191, approximately $159 per square foot. 1918 SW 29th Terrace is a home located in Lee County with nearby schools including Cape Elementary School, Caloosa Elementary School, and Tropic Isles Elementary School.
Ownership History
Date
Name
Owned For
Owner Type
Purchase Details
Closed on
Oct 25, 2024
Sold by
Sunshine Sf Holdings Llc
Bought by
A Better Investment
Current Estimated Value
Purchase Details
Closed on
Jul 19, 2022
Sold by
1918 Sw 29Th Terrace Land Trust
Bought by
Sunshine Sf Holdings Llc
Purchase Details
Closed on
Jul 31, 2019
Sold by
Kehoe William and Kehoe Maria
Bought by
Rotor Holdings Inc and 1918 Sw 29Th Terrace Land Trust
Purchase Details
Closed on
Jul 21, 2009
Sold by
Delpopolo Stephen
Bought by
First Horizon Home Loans
Purchase Details
Closed on
Sep 19, 2005
Sold by
Antonsen Wallace and Antonsen Carrie Lynn
Bought by
Delpopolo Stephen
Home Financials for this Owner
Home Financials are based on the most recent Mortgage that was taken out on this home.
Original Mortgage
$373,290
Interest Rate
7.25%
Mortgage Type
Construction
Purchase Details
Closed on
Feb 5, 2005
Sold by
Fortman Richard L and Soprych Peggy A
Bought by
Antonsen Wallace and Antonsen Carrie Lynn
Create a Home Valuation Report for This Property
The Home Valuation Report is an in-depth analysis detailing your home's value as well as a comparison with similar homes in the area
Home Values in the Area
Average Home Value in this Area
Purchase History
| Date | Buyer | Sale Price | Title Company |
|---|---|---|---|
| A Better Investment | $300,000 | Aries Title | |
| Sunshine Sf Holdings Llc | $100 | Aries Title | |
| Rotor Holdings Inc | $201,000 | Attorney | |
| First Horizon Home Loans | -- | Attorney | |
| Delpopolo Stephen | $115,000 | Title Professionals Of Fl | |
| Antonsen Wallace | -- | -- |
Source: Public Records
Mortgage History
| Date | Status | Borrower | Loan Amount |
|---|---|---|---|
| Previous Owner | Delpopolo Stephen | $373,290 |
Source: Public Records
Tax History Compared to Growth
Tax History
| Year | Tax Paid | Tax Assessment Tax Assessment Total Assessment is a certain percentage of the fair market value that is determined by local assessors to be the total taxable value of land and additions on the property. | Land | Improvement |
|---|---|---|---|---|
| 2025 | $7,361 | $318,943 | $88,825 | $209,073 |
| 2024 | $8,958 | $359,160 | $85,677 | $246,150 |
| 2023 | $8,958 | $458,919 | $68,518 | $366,821 |
| 2022 | $6,962 | $309,730 | $0 | $0 |
| 2021 | $6,361 | $282,574 | $34,000 | $248,574 |
| 2020 | $6,073 | $255,975 | $29,850 | $226,125 |
| 2019 | $7,014 | $239,029 | $24,100 | $214,929 |
| 2018 | $6,921 | $241,447 | $23,000 | $218,447 |
| 2017 | $6,691 | $234,976 | $16,000 | $218,976 |
| 2016 | $6,435 | $226,637 | $16,000 | $210,637 |
| 2015 | $6,163 | $196,704 | $10,000 | $186,704 |
| 2014 | $5,939 | $172,502 | $7,900 | $164,602 |
| 2013 | -- | $157,112 | $4,700 | $152,412 |
Source: Public Records
Map
Nearby Homes
- 1922 SW 29th Terrace
- 1918 SW 30th Terrace
- 2014 SW 30th St
- 2521 SW 30th Terrace
- 2008 SW 28th Ln
- 2019 SW 29th Terrace
- 1820 SW 29th Terrace
- 2024 SW 29th Terrace
- 1819 SW 29th Terrace
- 1824 SW 28th Ln
- 2013 SW 31st Terrace
- 1817 SW 29th Terrace
- 2000 SW 28th Terrace
- 1919 SW 31st Terrace
- 2106 SW 29th Terrace
- 1812 SW 28th Ln
- 1804 SW 29th Terrace
- 1826 SW 28th Terrace
- 2111 SW 30th St
- 2033 SW 31st Terrace
- 1914 SW 29th Terrace
- 1913 SW 30th St
- 1908 SW 29th Terrace
- 1917 SW 29th Terrace
- 1913 SW 29th Terrace
- 1909 SW 30th St
- 1906 SW 29th Terrace
- 2000 SW 29th Terrace
- 1909 SW 29th Terrace
- 2014 SW 29th Terrace
- 1905 SW 30th St
- 1905 SW 29th Terrace
- 1918 SW 30th St
- 1914 SW 30th St
- 1902 SW 29th Terrace
- 1903 SW 29th Terrace
- 1901 SW 30th St
- 2003 SW 30th St Unit 502
- 2003 SW 30th St
- 1901 SW 29th Terrace