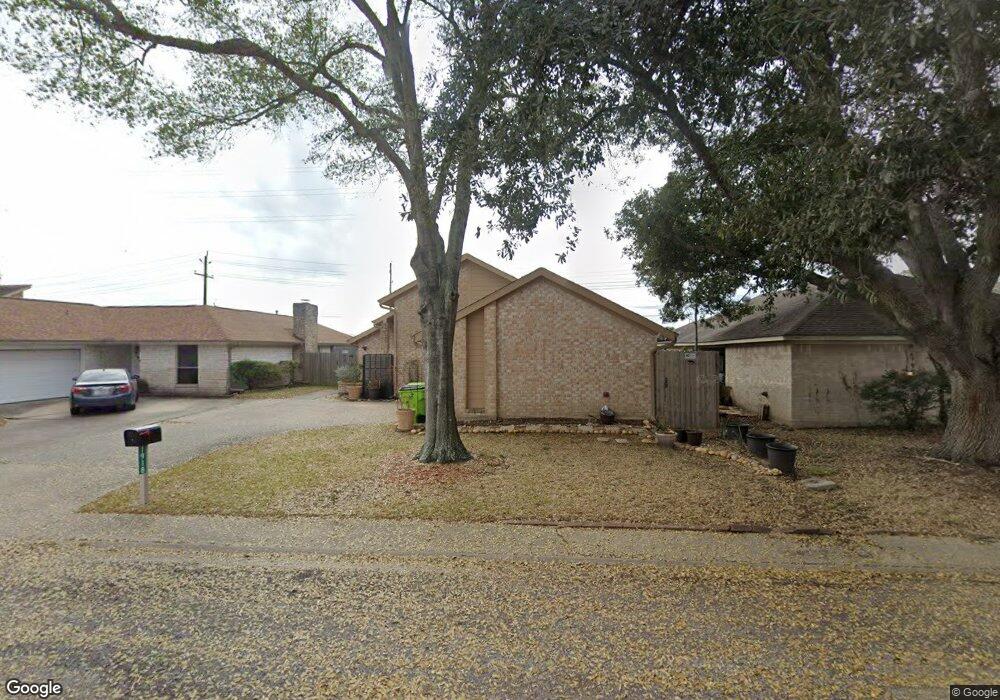
1918 Teakwood St Richmond, TX 77469
Estimated Value: $254,000 - $258,000
3
Beds
2
Baths
1,690
Sq Ft
$151/Sq Ft
Est. Value
About This Home
This home is located at 1918 Teakwood St, Richmond, TX 77469 and is currently estimated at $255,910, approximately $151 per square foot. 1918 Teakwood St is a home located in Fort Bend County with nearby schools including Smith Elementary School, J J Wessendorff Middle School, and Lamar Junior High School.
Ownership History
Date
Name
Owned For
Owner Type
Purchase Details
Closed on
Sep 15, 2009
Sold by
Gubbels Matthew R and Gubbels Pamela L
Bought by
Hall Trobi
Current Estimated Value
Home Financials for this Owner
Home Financials are based on the most recent Mortgage that was taken out on this home.
Original Mortgage
$96,300
Outstanding Balance
$63,012
Interest Rate
5.2%
Mortgage Type
New Conventional
Estimated Equity
$192,898
Purchase Details
Closed on
Nov 12, 1997
Sold by
Bernard Charles R and Bernard Paulette
Bought by
Cubbels Matthew R and Moreno Pamela L
Home Financials for this Owner
Home Financials are based on the most recent Mortgage that was taken out on this home.
Original Mortgage
$48,000
Interest Rate
6.62%
Mortgage Type
Purchase Money Mortgage
Purchase Details
Closed on
Aug 7, 1987
Sold by
Zwahr George Eta
Bought by
Hall Trobi
Create a Home Valuation Report for This Property
The Home Valuation Report is an in-depth analysis detailing your home's value as well as a comparison with similar homes in the area
Home Values in the Area
Average Home Value in this Area
Purchase History
| Date | Buyer | Sale Price | Title Company |
|---|---|---|---|
| Hall Trobi | -- | Startex Title Company | |
| Cubbels Matthew R | -- | Alamo Title | |
| Hall Trobi | -- | -- |
Source: Public Records
Mortgage History
| Date | Status | Borrower | Loan Amount |
|---|---|---|---|
| Open | Hall Trobi | $96,300 | |
| Previous Owner | Cubbels Matthew R | $48,000 |
Source: Public Records
Tax History Compared to Growth
Tax History
| Year | Tax Paid | Tax Assessment Tax Assessment Total Assessment is a certain percentage of the fair market value that is determined by local assessors to be the total taxable value of land and additions on the property. | Land | Improvement |
|---|---|---|---|---|
| 2025 | -- | $246,401 | $20,995 | $225,406 |
| 2024 | -- | $232,647 | $1,693 | $230,954 |
| 2023 | $1,124 | $211,497 | $0 | $239,575 |
| 2022 | $3,821 | $192,270 | $0 | $205,470 |
| 2021 | $4,151 | $174,790 | $16,150 | $158,640 |
| 2020 | $3,940 | $163,490 | $16,150 | $147,340 |
| 2019 | $3,796 | $148,630 | $16,150 | $132,480 |
| 2018 | $3,750 | $145,950 | $16,150 | $129,800 |
| 2017 | $3,448 | $132,680 | $16,150 | $116,530 |
| 2016 | $3,259 | $125,400 | $16,150 | $109,250 |
| 2015 | $2,858 | $126,500 | $16,150 | $110,350 |
| 2014 | $2,731 | $115,000 | $16,150 | $98,850 |
Source: Public Records
Map
Nearby Homes
- 1922 Teakwood St
- 0 Fm 2218 Unit 25550047
- 1805 Hawthorn Dr
- 4502 River Rd
- 1809 Hawthorn Dr
- 805 Chateau Place
- 2015 Tanglelane St
- 000 Fm 2218 Rd
- 1004 Country Club Dr
- 6303 Buffalo Bend Ln
- 0 Meadow Ln
- 24351 Dyer Hill Way
- The Royal (L481) Plan at Wall Street Village
- The Henderson (L404) Plan at Wall Street Village
- The Kendall (L485) Plan at Wall Street Village
- The Preston (L403) Plan at Wall Street Village
- The Greenville (L400) Plan at Wall Street Village
- The Kessler (L454) Plan at Wall Street Village
- The Pearl (L452) Plan at Wall Street Village
- The Ian (L465) Plan at Wall Street Village
- 1920 Teakwood St
- 1916 Teakwood St
- 1914 Teakwood St
- 1924 Teakwood St
- 1912 Teakwood St
- 703 Cypress Dr
- 1919 Teakwood St
- 1523 Chestnut Ln
- 1910 Teakwood St
- 1926 Teakwood St
- 1519 Chestnut Ln
- 1921 Teakwood St
- 1517 Chestnut Ln
- 1613 Chestnut Ln
- 1923 Teakwood St
- 1515 Chestnut Ln
- 2001 Crestwood Dr
- 1925 Teakwood St
- 1927 Teakwood St
- 1615 Chestnut Ln