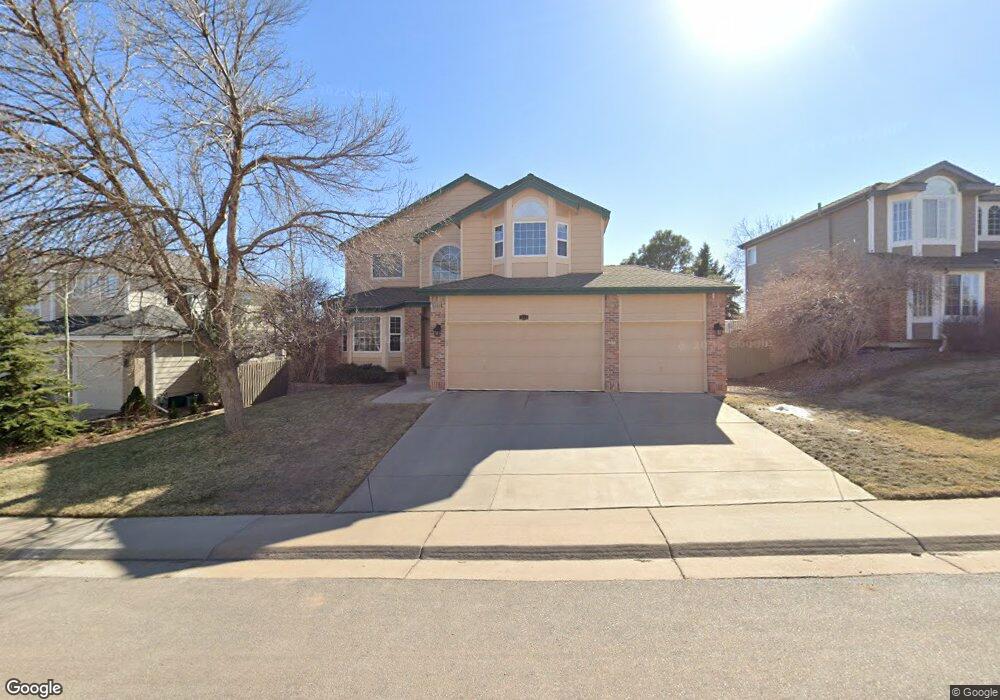
1919 Cedaridge Cir Superior, CO 80027
Estimated Value: $929,592 - $1,023,000
5
Beds
5
Baths
2,203
Sq Ft
$448/Sq Ft
Est. Value
About This Home
This home is located at 1919 Cedaridge Cir, Superior, CO 80027 and is currently estimated at $987,898, approximately $448 per square foot. 1919 Cedaridge Cir is a home located in Boulder County with nearby schools including Eldorado K-8 School, Superior Elementary School, and Monarch High School.
Ownership History
Date
Name
Owned For
Owner Type
Purchase Details
Closed on
Dec 8, 2025
Sold by
Hudson Randall W and Hudson Dolores V
Bought by
Hudson Family Trust
Current Estimated Value
Purchase Details
Closed on
Nov 13, 1999
Sold by
Samra Amarpal S and Samra Mandeep
Bought by
Hudson Randall W
Home Financials for this Owner
Home Financials are based on the most recent Mortgage that was taken out on this home.
Original Mortgage
$240,000
Interest Rate
7.83%
Purchase Details
Closed on
Jul 12, 1994
Sold by
Fisher Patricia F and Fisher Jeffrey L
Bought by
Samra Amarpal S
Home Financials for this Owner
Home Financials are based on the most recent Mortgage that was taken out on this home.
Original Mortgage
$192,600
Interest Rate
8.52%
Purchase Details
Closed on
Oct 27, 1993
Sold by
Richmond Homes Inc Ii
Bought by
Fisher Patricia F
Home Financials for this Owner
Home Financials are based on the most recent Mortgage that was taken out on this home.
Original Mortgage
$148,600
Interest Rate
6.12%
Purchase Details
Closed on
Mar 16, 1993
Bought by
Hudson Randall W and Hudson Dolores V
Create a Home Valuation Report for This Property
The Home Valuation Report is an in-depth analysis detailing your home's value as well as a comparison with similar homes in the area
Home Values in the Area
Average Home Value in this Area
Purchase History
We collect this data history from publicly available records. To have your information removed, we recommend requesting removal directly through your county’s website.
| Date | Buyer | Sale Price | Title Company |
|---|---|---|---|
| Hudson Family Trust | -- | None Listed On Document | |
| Hudson Randall W | $284,000 | -- | |
| Samra Amarpal S | $214,000 | -- | |
| Fisher Patricia F | $185,794 | Land Title | |
| Hudson Randall W | -- | -- |
Source: Public Records
Mortgage History
We collect this data history from publicly available records. To have your information removed, we recommend requesting removal directly through your county’s website.
| Date | Status | Borrower | Loan Amount |
|---|---|---|---|
| Previous Owner | Hudson Randall W | $240,000 | |
| Previous Owner | Samra Amarpal S | $192,600 | |
| Previous Owner | Fisher Patricia F | $148,600 |
Source: Public Records
Tax History
| Year | Tax Paid | Tax Assessment Tax Assessment Total Assessment is a certain percentage of the fair market value that is determined by local assessors to be the total taxable value of land and additions on the property. | Land | Improvement |
|---|---|---|---|---|
| 2025 | $5,655 | $62,166 | $25,201 | $36,965 |
| 2024 | $4,904 | $57,138 | $23,163 | $33,975 |
| 2023 | $4,836 | $54,022 | $20,442 | $37,265 |
| 2022 | $3,808 | $43,354 | $15,929 | $27,425 |
| 2021 | $4,173 | $48,477 | $17,811 | $30,666 |
| 2020 | $3,884 | $44,116 | $18,233 | $25,883 |
| 2019 | $3,830 | $44,116 | $18,233 | $25,883 |
| 2018 | $3,388 | $39,593 | $12,600 | $26,993 |
| 2017 | $4,233 | $43,772 | $13,930 | $29,842 |
| 2016 | $4,229 | $38,216 | $13,054 | $25,162 |
| 2015 | $4,019 | $33,249 | $13,293 | $19,956 |
| 2014 | $3,530 | $33,249 | $13,293 | $19,956 |
Source: Public Records
Map
Nearby Homes
- 1899 Breen Ln
- 1687 Reliance Ct
- 1514 S Proctor Ct
- 1009 Monarch Way
- 1182 E Riverbend St
- 1500 S Vona Ct
- 977 Eldorado Dr
- 1604 E Weldona Way
- 1815 Spaulding Cir Unit 1815
- 1686 Harris St Unit 1686
- 1696 Harris St Unit 1696
- 1630 Egret Way Unit 20
- 1843 Mallard Dr
- 2142 Concord Ln Unit 10
- 908 E Kirk Way
- 2560 Clayton Cir
- 1785 Vernon Ln
- 2225 Clayton Cir
- 2040 Shamrock Dr Unit 2040
- 2020 Shamrock Dr Unit 2020
- 1929 Cedaridge Cir
- 1899 Cedaridge Cir
- 1949 Cedaridge Cir
- 1889 Cedaridge Cir
- 1904 Cedaridge Cir
- 1914 Cedaridge Cir
- 1884 Cedaridge Cir
- 1924 Cedaridge Cir
- 1959 Cedaridge Cir
- 2002 Grayden Ct
- 1879 Cedaridge Cir
- 1874 Cedaridge Cir
- 1934 Cedaridge Cir
- 1944 Cedaridge Cir
- 1979 Cedaridge Cir
- 1854 Cedaridge Cir
- 2012 Grayden Ct
- 1947 Eldorado Dr
- 1967 Eldorado Dr
- 1997 Grayden Ct
Your Personal Tour Guide
Ask me questions while you tour the home.