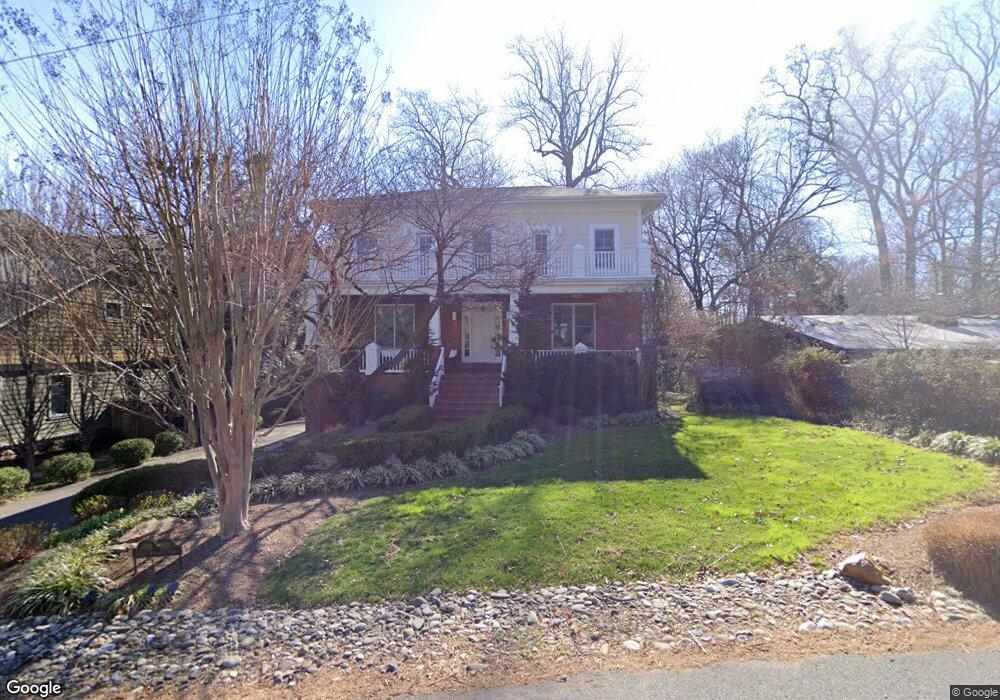
1919 Franklin Ave McLean, VA 22101
Estimated Value: $1,373,000 - $1,917,000
--
Bed
4
Baths
3,828
Sq Ft
$453/Sq Ft
Est. Value
About This Home
This home is located at 1919 Franklin Ave, McLean, VA 22101 and is currently estimated at $1,735,351, approximately $453 per square foot. 1919 Franklin Ave is a home located in Fairfax County with nearby schools including Chesterbrook Elementary School, Longfellow Middle School, and Montessori School Of Mclean.
Ownership History
Date
Name
Owned For
Owner Type
Purchase Details
Closed on
Oct 18, 2019
Sold by
Kneller Susan
Bought by
Kneller Susan and The Alan L Madian By Pass Trust
Current Estimated Value
Home Financials for this Owner
Home Financials are based on the most recent Mortgage that was taken out on this home.
Original Mortgage
$312,835
Outstanding Balance
$208,030
Interest Rate
3.4%
Mortgage Type
Seller Take Back
Estimated Equity
$1,527,321
Purchase Details
Closed on
Jun 5, 2001
Sold by
Osage Dev L L C
Bought by
Knellar Susan
Create a Home Valuation Report for This Property
The Home Valuation Report is an in-depth analysis detailing your home's value as well as a comparison with similar homes in the area
Home Values in the Area
Average Home Value in this Area
Purchase History
| Date | Buyer | Sale Price | Title Company |
|---|---|---|---|
| Kneller Susan | $612,835 | Monarch Title | |
| Knellar Susan | $939,000 | -- |
Source: Public Records
Mortgage History
| Date | Status | Borrower | Loan Amount |
|---|---|---|---|
| Open | Kneller Susan | $312,835 |
Source: Public Records
Tax History Compared to Growth
Tax History
| Year | Tax Paid | Tax Assessment Tax Assessment Total Assessment is a certain percentage of the fair market value that is determined by local assessors to be the total taxable value of land and additions on the property. | Land | Improvement |
|---|---|---|---|---|
| 2025 | $17,668 | $1,670,970 | $824,000 | $846,970 |
| 2024 | $17,668 | $1,425,450 | $785,000 | $640,450 |
| 2023 | $16,533 | $1,378,870 | $785,000 | $593,870 |
| 2022 | $15,735 | $1,294,870 | $701,000 | $593,870 |
| 2021 | $14,598 | $1,174,870 | $581,000 | $593,870 |
| 2020 | $14,686 | $1,174,870 | $581,000 | $593,870 |
| 2019 | $13,991 | $1,116,590 | $551,000 | $565,590 |
| 2018 | $11,772 | $1,023,670 | $525,000 | $498,670 |
| 2017 | $12,928 | $1,051,170 | $525,000 | $526,170 |
| 2016 | $12,563 | $1,021,110 | $520,000 | $501,110 |
| 2015 | $11,902 | $1,001,510 | $515,000 | $486,510 |
| 2014 | $11,762 | $991,510 | $505,000 | $486,510 |
Source: Public Records
Map
Nearby Homes
- 6511 Ivy Hill Dr
- 2107 Elliott Ave
- 1843 Rhode Island Ave
- 6434 Noble Dr
- 3623 N Rockingham St
- 2115 Natahoa Ct
- 1830 Massachusetts Ave
- 2123 Natahoa Ct
- 6449 Orland St
- 2136 Powhatan St
- 6424 Divine St
- 2005 Highboro Way
- 1904 Lamson Place
- 6514 Byrnes Dr
- 1730 Barbee St
- 6528 36th St N
- 6607 Midhill Place
- 2125 Hilltop Place
- 1705 East Ave
- 6304 Old Dominion Dr
- 1921 Franklin Ave
- 1917 Franklin Ave
- 1944 Virginia Ave
- 1942 Virginia Ave
- 1948 Virginia Ave
- 1923 Franklin Ave
- 1918 Franklin Ave
- 1920 Franklin Ave
- 1950 Virginia Ave
- 1914 Franklin Ave
- 1940 Virginia Ave
- 1922 Franklin Ave
- 1925 Franklin Ave
- 1915 Franklin Ave
- 1980 Massachusetts Ave
- 1978 Massachusetts Ave
- 1932 Virginia Ave
- 1947 Virginia Ave
- 1939 Virginia Ave
- 1950 Massachusetts Ave