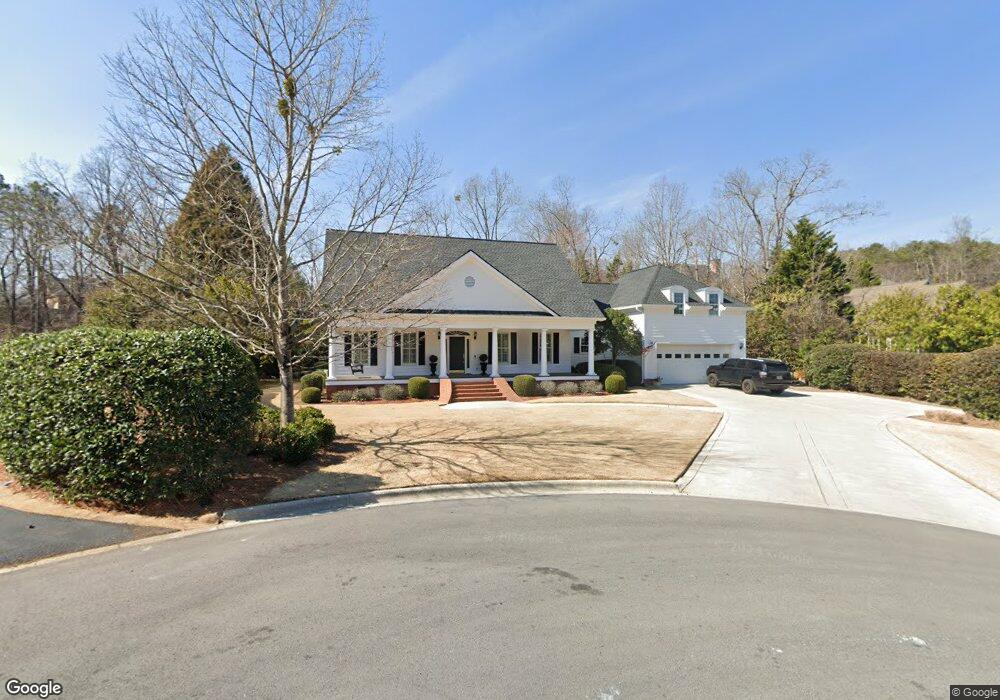
1919 Hathaway Dalton, GA 30720
Estimated Value: $622,463 - $778,000
4
Beds
4
Baths
4,300
Sq Ft
$163/Sq Ft
Est. Value
About This Home
This home is located at 1919 Hathaway, Dalton, GA 30720 and is currently estimated at $701,154, approximately $163 per square foot. 1919 Hathaway is a home located in Whitfield County with nearby schools including Westwood Elementary School, Dalton Middle School, and Dalton High School.
Ownership History
Date
Name
Owned For
Owner Type
Purchase Details
Closed on
May 23, 2019
Sold by
Ellis Ryann L
Bought by
Douglas John M and Douglas Lillian L
Current Estimated Value
Home Financials for this Owner
Home Financials are based on the most recent Mortgage that was taken out on this home.
Original Mortgage
$250,000
Outstanding Balance
$219,801
Interest Rate
4.2%
Mortgage Type
New Conventional
Estimated Equity
$481,353
Purchase Details
Closed on
Sep 10, 2012
Sold by
Capel Larry H
Bought by
Bllis Mark L and Ellis Ryann L
Home Financials for this Owner
Home Financials are based on the most recent Mortgage that was taken out on this home.
Original Mortgage
$284,000
Interest Rate
3.63%
Mortgage Type
New Conventional
Purchase Details
Closed on
Nov 1, 1997
Bought by
Capel Larry H and Capel Tammy C
Create a Home Valuation Report for This Property
The Home Valuation Report is an in-depth analysis detailing your home's value as well as a comparison with similar homes in the area
Home Values in the Area
Average Home Value in this Area
Purchase History
| Date | Buyer | Sale Price | Title Company |
|---|---|---|---|
| Douglas John M | $425,000 | -- | |
| Bllis Mark L | $335,000 | -- | |
| Capel Larry H | $42,000 | -- |
Source: Public Records
Mortgage History
| Date | Status | Borrower | Loan Amount |
|---|---|---|---|
| Open | Douglas John M | $250,000 | |
| Previous Owner | Bllis Mark L | $284,000 |
Source: Public Records
Tax History Compared to Growth
Tax History
| Year | Tax Paid | Tax Assessment Tax Assessment Total Assessment is a certain percentage of the fair market value that is determined by local assessors to be the total taxable value of land and additions on the property. | Land | Improvement |
|---|---|---|---|---|
| 2024 | $5,744 | $207,592 | $25,000 | $182,592 |
| 2023 | $5,744 | $161,550 | $21,600 | $139,950 |
| 2022 | $4,253 | $130,878 | $16,800 | $114,078 |
| 2021 | $4,260 | $130,878 | $16,800 | $114,078 |
| 2020 | $4,413 | $130,878 | $16,800 | $114,078 |
| 2019 | $4,546 | $130,878 | $16,800 | $114,078 |
| 2018 | $3,050 | $131,403 | $16,800 | $114,603 |
| 2017 | $2,587 | $121,348 | $16,800 | $104,548 |
| 2016 | $2,760 | $125,446 | $22,680 | $102,766 |
| 2014 | $2,035 | $114,139 | $21,000 | $93,139 |
| 2013 | -- | $114,138 | $21,000 | $93,138 |
Source: Public Records
Map
Nearby Homes
- 1910 Cameron
- 2118 Chatham
- 2100 Coventry
- 0 Chatham Dr
- 00 Chatham Dr
- 1705 Wellington NW
- Lot 5 Haig Mill Lake Rd
- 1900 Meadowbrook Cir NW
- 1929 Meadowbrook Cir NW
- 1961 Meadowbrook Cir NW
- 1504 Arlington Dr NW
- 1080 Estate Dr
- 1006 Willowdale Rd NW
- 204 Roslyn Ct
- 1521 Ashton Woods Way
- Tract 2 Willowdale Rd Unit TRACT 2
- 114 Roslyn Ct
- 000 Reed Rd
- 1505 Anthony Ave
- 0 N Park Dr