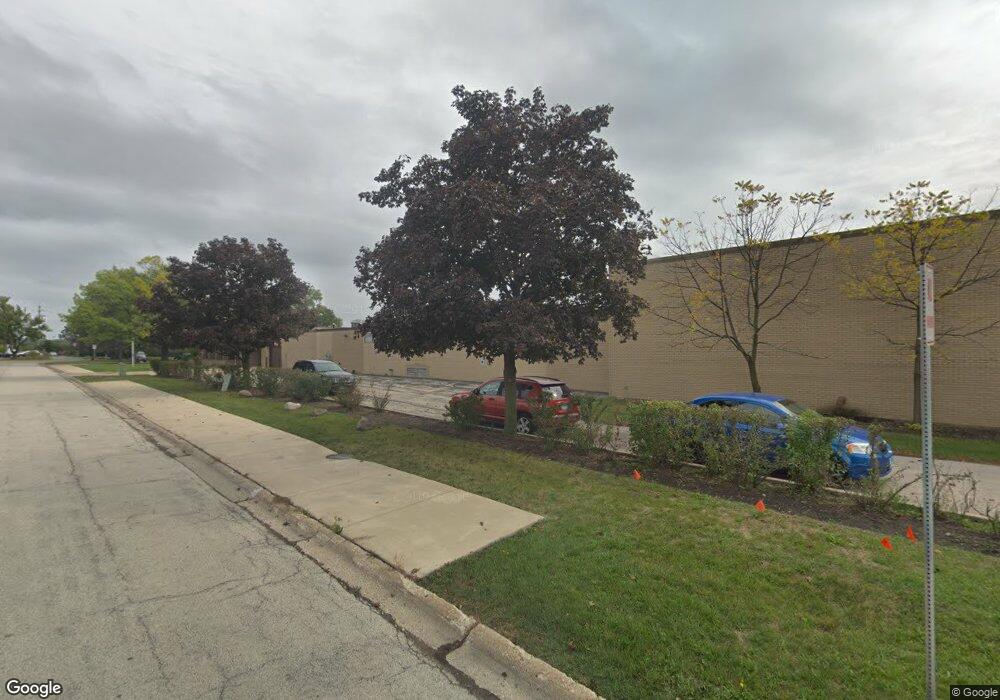
1919 Stanley St Northbrook, IL 60062
--
Bed
--
Bath
33,911
Sq Ft
1.99
Acres
About This Home
This home is located at 1919 Stanley St, Northbrook, IL 60062. 1919 Stanley St is a home located in Cook County with nearby schools including Wescott Elementary School, Maple School, and Glenbrook North High School.
Ownership History
Date
Name
Owned For
Owner Type
Purchase Details
Closed on
Nov 17, 2017
Sold by
Ok Real Estate Ii Llc
Bought by
Ji Realty Company Llc
Home Financials for this Owner
Home Financials are based on the most recent Mortgage that was taken out on this home.
Original Mortgage
$880,000
Outstanding Balance
$738,564
Interest Rate
3.91%
Mortgage Type
Commercial
Purchase Details
Closed on
Apr 6, 2012
Sold by
Stanley Llc
Bought by
Ok Real Estate Ii Llc
Home Financials for this Owner
Home Financials are based on the most recent Mortgage that was taken out on this home.
Original Mortgage
$875,000
Interest Rate
3.9%
Mortgage Type
Commercial
Purchase Details
Closed on
Dec 11, 2008
Sold by
Chicago Title Land Trust Company
Bought by
Stanley Llc
Purchase Details
Closed on
Sep 8, 1995
Sold by
Fromm International Inc
Bought by
American National Bk & Tr Co Of Chicago
Purchase Details
Closed on
Mar 8, 1994
Sold by
Deublin Company
Bought by
Illinois Razor Strop Company
Create a Home Valuation Report for This Property
The Home Valuation Report is an in-depth analysis detailing your home's value as well as a comparison with similar homes in the area
Home Values in the Area
Average Home Value in this Area
Purchase History
| Date | Buyer | Sale Price | Title Company |
|---|---|---|---|
| Ji Realty Company Llc | $1,100,000 | Attorney | |
| Ok Real Estate Ii Llc | $873,000 | Stewart Title Company | |
| Stanley Llc | -- | Chicago Title Land Trust Co | |
| American National Bk & Tr Co Of Chicago | $850,000 | -- | |
| Illinois Razor Strop Company | $546,666 | -- |
Source: Public Records
Mortgage History
| Date | Status | Borrower | Loan Amount |
|---|---|---|---|
| Open | Ji Realty Company Llc | $880,000 | |
| Previous Owner | Ok Real Estate Ii Llc | $875,000 |
Source: Public Records
Tax History Compared to Growth
Tax History
| Year | Tax Paid | Tax Assessment Tax Assessment Total Assessment is a certain percentage of the fair market value that is determined by local assessors to be the total taxable value of land and additions on the property. | Land | Improvement |
|---|---|---|---|---|
| 2024 | $20,291 | $85,852 | $26,992 | $58,860 |
| 2023 | $19,739 | $85,852 | $26,992 | $58,860 |
| 2022 | $19,739 | $85,854 | $26,992 | $58,862 |
| 2021 | $18,254 | $70,289 | $26,991 | $43,298 |
| 2020 | $18,073 | $70,289 | $26,991 | $43,298 |
| 2019 | $23,657 | $105,035 | $67,479 | $37,556 |
| 2018 | $14,342 | $58,759 | $42,487 | $16,272 |
| 2017 | $29,605 | $123,837 | $42,487 | $81,350 |
| 2016 | $26,633 | $123,837 | $42,487 | $81,350 |
| 2015 | $29,723 | $124,133 | $37,488 | $86,645 |
| 2014 | $28,982 | $124,133 | $37,488 | $86,645 |
| 2013 | $28,611 | $124,133 | $37,488 | $86,645 |
Source: Public Records
Map
Nearby Homes
- 1997 Kingsley Cir
- 1950 Farnsworth Ln Unit 202
- 1947 Summerton Place
- 2117 Illinois Rd
- 2067 Butternut Ln
- 2221 Illinois Rd
- 1721 Elm Ave
- 2005 Greenview Rd
- 1412 Sycamore Ln
- 2411 Woodlawn Rd
- 2130 Mallard Dr
- 1430 Voltz Rd
- 2050 Valencia Dr Unit 405C
- 2378 Salceda Dr Unit 25B2378S
- 3065 Lexington Ln Unit 17L41
- 1302 Waukegan Rd
- 2425 El Cid Ln
- 2409 Center Ave
- 1443 Woodhill Dr
- 2545 Salceda Dr Unit 5B2545S
- 1935 Stanley St
- 1942 Kingsley Cir
- 1944 Kingsley Cir
- 1946 Kingsley Cir
- 1948 Kingsley Cir
- 1948 Kingsley Cir
- 1950 Kingsley Cir
- 1954 Kingsley Cir
- 1954 Kingsley Cir
- 1825 Shermer Rd
- 1952 Kingsley Cir
- 1956 Kingsley Cir
- 1958 Kingsley Cir
- 1960 Kingsley Cir
- 1960 Kingsley Cir
- 1962 Kingsley Cir
- 1964 Kingsley Cir
- 1932 Kingsley Cir
- 1934 Kingsley Cir
- 1966 Kingsley Cir