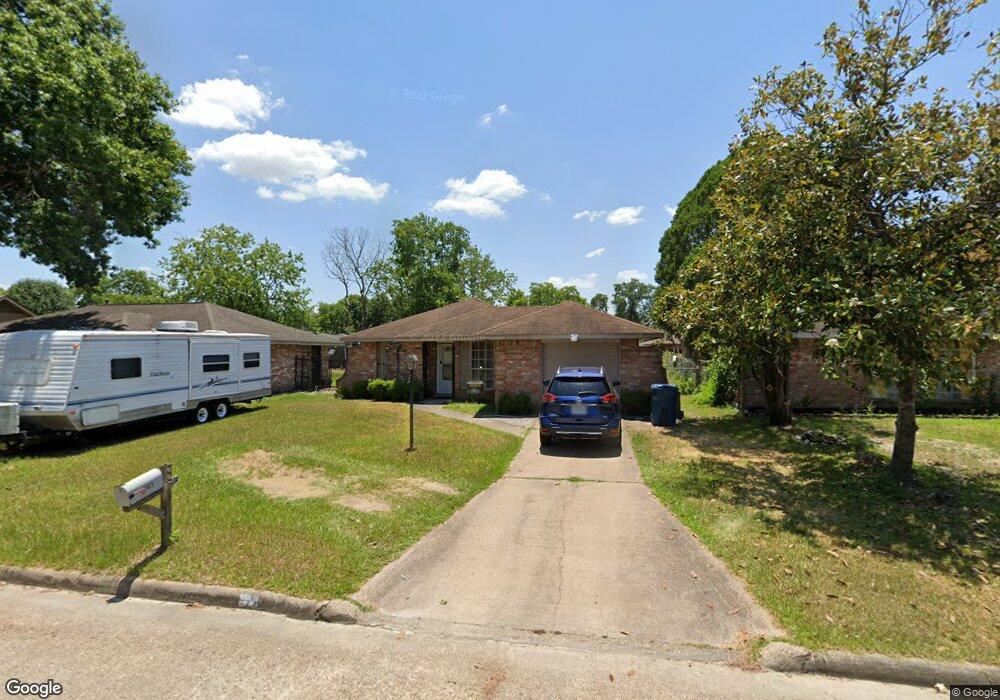
1919 Twinbrooke Dr Houston, TX 77088
Acres Homes NeighborhoodEstimated Value: $158,000 - $193,000
3
Beds
1
Bath
932
Sq Ft
$184/Sq Ft
Est. Value
About This Home
This home is located at 1919 Twinbrooke Dr, Houston, TX 77088 and is currently estimated at $171,379, approximately $183 per square foot. 1919 Twinbrooke Dr is a home located in Harris County with nearby schools including Hill Intermediate School, Stovall School, and Dr. Viola K. Garcia Middle School.
Ownership History
Date
Name
Owned For
Owner Type
Purchase Details
Closed on
Apr 19, 2012
Sold by
Secretary Of Hud
Bought by
Martin Tejeda Ricardo and Martin Olga
Current Estimated Value
Purchase Details
Closed on
Apr 15, 2011
Sold by
Midfirst Bank
Bought by
The Secretary Of Housing & Urban Develop
Purchase Details
Closed on
Apr 5, 2011
Sold by
Swann Eunice L
Bought by
Midfirst Bank
Purchase Details
Closed on
Sep 25, 1997
Sold by
Harp Inc
Bought by
Potts Eunice L
Home Financials for this Owner
Home Financials are based on the most recent Mortgage that was taken out on this home.
Original Mortgage
$41,155
Interest Rate
7.49%
Mortgage Type
FHA
Purchase Details
Closed on
Mar 6, 1995
Sold by
Hill Jerel J
Bought by
Harp Inc
Home Financials for this Owner
Home Financials are based on the most recent Mortgage that was taken out on this home.
Original Mortgage
$25,600
Interest Rate
8.86%
Mortgage Type
Purchase Money Mortgage
Create a Home Valuation Report for This Property
The Home Valuation Report is an in-depth analysis detailing your home's value as well as a comparison with similar homes in the area
Home Values in the Area
Average Home Value in this Area
Purchase History
| Date | Buyer | Sale Price | Title Company |
|---|---|---|---|
| Martin Tejeda Ricardo | -- | None Available | |
| The Secretary Of Housing & Urban Develop | -- | None Available | |
| Midfirst Bank | $52,399 | None Available | |
| Potts Eunice L | -- | Commonwealth Land Title Co | |
| Harp Inc | -- | American Title Company | |
| Hill Jerel J | -- | American Title Company |
Source: Public Records
Mortgage History
| Date | Status | Borrower | Loan Amount |
|---|---|---|---|
| Previous Owner | Potts Eunice L | $41,155 | |
| Previous Owner | Harp Inc | $25,600 |
Source: Public Records
Tax History Compared to Growth
Tax History
| Year | Tax Paid | Tax Assessment Tax Assessment Total Assessment is a certain percentage of the fair market value that is determined by local assessors to be the total taxable value of land and additions on the property. | Land | Improvement |
|---|---|---|---|---|
| 2025 | $1,392 | $148,441 | $43,680 | $104,761 |
| 2024 | $1,392 | $148,441 | $43,680 | $104,761 |
| 2023 | $1,392 | $148,441 | $43,680 | $104,761 |
| 2022 | $2,285 | $122,846 | $34,944 | $87,902 |
| 2021 | $2,177 | $101,024 | $34,944 | $66,080 |
| 2020 | $2,150 | $94,639 | $13,978 | $80,661 |
| 2019 | $2,059 | $86,831 | $13,978 | $72,853 |
| 2018 | $771 | $78,671 | $13,978 | $64,693 |
| 2017 | $1,639 | $78,671 | $13,978 | $64,693 |
| 2016 | $1,490 | $73,779 | $13,978 | $59,801 |
| 2015 | $944 | $67,808 | $13,978 | $53,830 |
| 2014 | $944 | $54,340 | $13,978 | $40,362 |
Source: Public Records
Map
Nearby Homes
- 1907 Bunzel St
- 2110 Mosher Ln
- 1806 Saddle Rock Dr Unit 770
- 1710 Beaver Bend Rd
- 8835 Glenhouse Dr
- 2146 Twinbrooke Dr
- 1615 Mosher Ln
- 2211 Mosher Ln
- 2214 Twinbrooke Dr
- 2003 Deerhurst Ln
- 1707 Winter Bay Ln
- 1330 Mosher Ln
- 0 Veterans Memorial Rd Unit 43555293
- 1326 Twin Falls Rd
- 9722 Willow
- 9208 Ab Wheatley St
- 9206 Ab Wheatley St
- 8615 Citation Ct
- 1559 Diplomat Way
- 2323 Hampton St
- 1923 Twinbrooke Dr
- 1915 Twinbrooke Dr
- 1918 Bunzel St
- 1927 Twinbrooke Dr
- 1911 Twinbrooke Dr
- 1922 Bunzel St
- 1914 Bunzel St
- 1926 Bunzel St
- 1910 Bunzel St
- 1918 Twinbrooke Dr
- 1931 Twinbrooke Dr
- 1907 Twinbrooke Dr
- 1922 Twinbrooke Dr
- 1914 Twinbrooke Dr
- 1930 Bunzel St
- 1926 Twinbrooke Dr
- 1910 Twinbrooke Dr
- 1906 Bunzel St
- 1935 Twinbrooke Dr
- 1930 Twinbrooke Dr