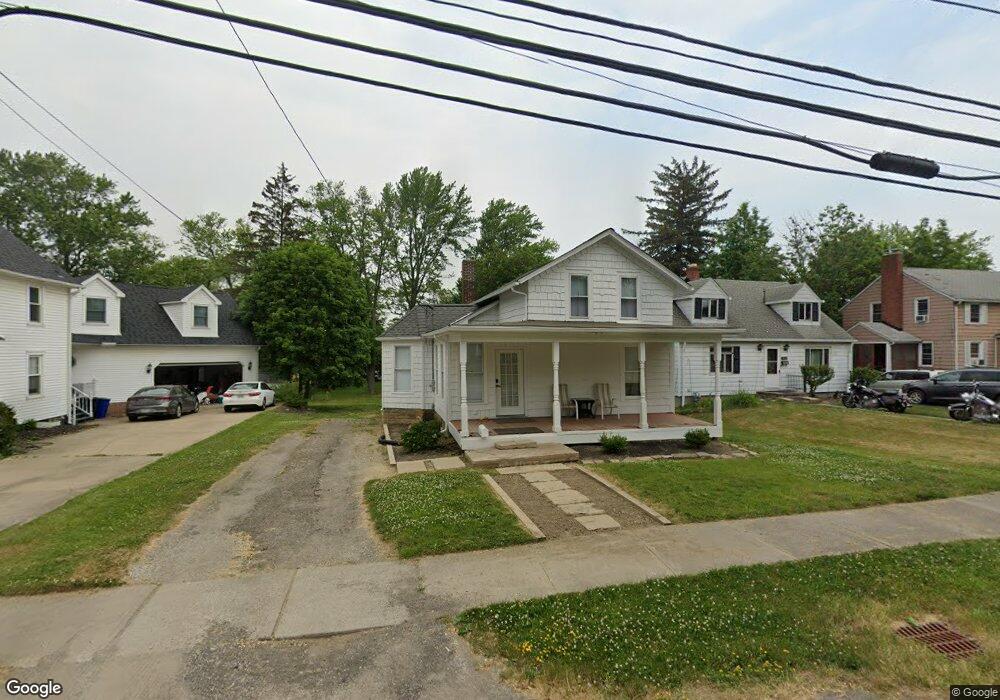
19190 Westwood Dr Strongsville, OH 44149
Estimated Value: $260,913 - $295,000
3
Beds
1
Bath
1,396
Sq Ft
$197/Sq Ft
Est. Value
About This Home
This home is located at 19190 Westwood Dr, Strongsville, OH 44149 and is currently estimated at $274,728, approximately $196 per square foot. 19190 Westwood Dr is a home located in Cuyahoga County with nearby schools including Strongsville High School, Strongsville Academy, and Sts Joseph & John Interparochial School.
Ownership History
Date
Name
Owned For
Owner Type
Purchase Details
Closed on
Jun 15, 2010
Sold by
Casterline Harold T and Simkus Caine Judith A
Bought by
Horne Travis L and Horne Travis
Current Estimated Value
Home Financials for this Owner
Home Financials are based on the most recent Mortgage that was taken out on this home.
Original Mortgage
$97,137
Outstanding Balance
$67,906
Interest Rate
5.87%
Mortgage Type
FHA
Estimated Equity
$206,822
Purchase Details
Closed on
May 15, 1992
Sold by
Rabant Lydia J
Bought by
Casterline Harold T
Purchase Details
Closed on
Jul 26, 1991
Sold by
Rabant Jason J
Bought by
Rabant Lydia J
Purchase Details
Closed on
Oct 14, 1983
Sold by
Wokokance William R
Bought by
Rabant Jason J
Purchase Details
Closed on
Jun 7, 1976
Sold by
Burens Geo W and Burens Sharon F
Bought by
Wokokance William R
Purchase Details
Closed on
Jan 1, 1975
Bought by
Burens Geo W and Burens Sharon F
Create a Home Valuation Report for This Property
The Home Valuation Report is an in-depth analysis detailing your home's value as well as a comparison with similar homes in the area
Home Values in the Area
Average Home Value in this Area
Purchase History
| Date | Buyer | Sale Price | Title Company |
|---|---|---|---|
| Horne Travis L | $127,000 | Patriot | |
| Casterline Harold T | $83,000 | -- | |
| Rabant Lydia J | -- | -- | |
| Rabant Jason J | $55,900 | -- | |
| Wokokance William R | $37,500 | -- | |
| Burens Geo W | -- | -- |
Source: Public Records
Mortgage History
| Date | Status | Borrower | Loan Amount |
|---|---|---|---|
| Open | Horne Travis L | $97,137 |
Source: Public Records
Tax History Compared to Growth
Tax History
| Year | Tax Paid | Tax Assessment Tax Assessment Total Assessment is a certain percentage of the fair market value that is determined by local assessors to be the total taxable value of land and additions on the property. | Land | Improvement |
|---|---|---|---|---|
| 2024 | $3,734 | $79,520 | $11,515 | $68,005 |
| 2023 | $3,691 | $58,950 | $14,180 | $44,770 |
| 2022 | $3,664 | $58,940 | $14,175 | $44,765 |
| 2021 | $3,635 | $58,940 | $14,180 | $44,770 |
| 2020 | $3,367 | $48,300 | $11,620 | $36,680 |
| 2019 | $3,268 | $138,000 | $33,200 | $104,800 |
| 2018 | $2,915 | $48,300 | $11,620 | $36,680 |
| 2017 | $2,916 | $43,960 | $9,170 | $34,790 |
| 2016 | $2,893 | $43,960 | $9,170 | $34,790 |
| 2015 | $2,847 | $43,960 | $9,170 | $34,790 |
| 2014 | $2,847 | $42,670 | $8,890 | $33,780 |
Source: Public Records
Map
Nearby Homes
- 13099 Olympus Way
- 13156 Olympus Way
- 19160 Wheelers Ln
- 13066 Olympus Way
- 14112 Settlers Way
- 19620 Porters Ln Unit 15F
- 12539 Olympus Way
- 12694 Ionia Ct
- 12385 Corinth Ct
- 18248 Meadow Ln
- 12647 Edgepark Cir
- 18336 Falling Water Rd
- 20078 Trapper Trail
- 13236 Tomson Dr
- 17809 Cliffside Dr Unit 4926
- 17945 Cliffside Dr
- 17289 Akita Ct Unit 4508
- 19513 Lunn Rd
- 12651 Alameda Dr
- 18630 Shurmer Rd
- 19162 Westwood Dr
- 19262 Westwood Dr
- 19194 Westwood Dr
- 19136 Westwood Dr
- 19226 Westwood Dr
- 19132 Westwood Dr
- 19199 Westwood Dr
- 19230 Westwood Dr
- 19128 Westwood Dr
- 19227 Westwood Dr
- 19163 Westwood Dr
- 19255 Westwood Dr
- 19191 Westwood Dr
- 19256 Westwood Dr
- 19098 Westwood Dr
- 19137 Westwood Dr
- 19137 Westwood Dr Unit 1
- 19137 Westwood Dr Unit 2
- 19259 Westwood Dr
- 19068 Westwood Dr