C
Seller's Agent in 2017
Chau Uong
Keller Williams Realty
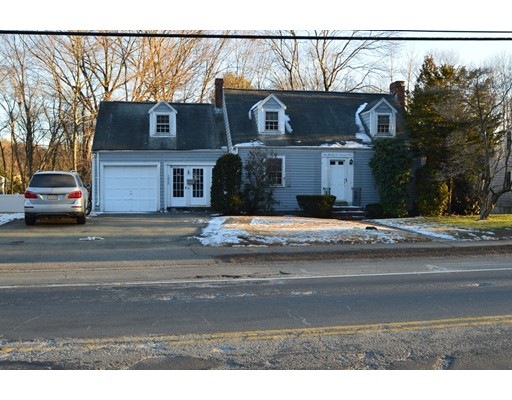
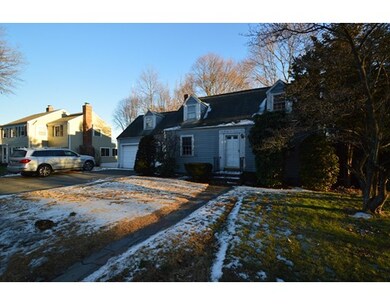
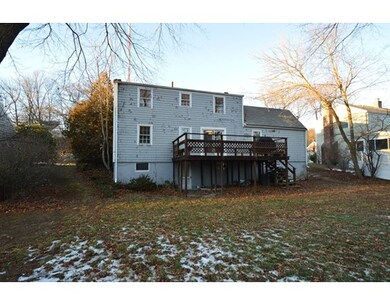
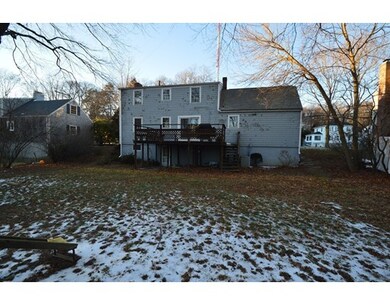
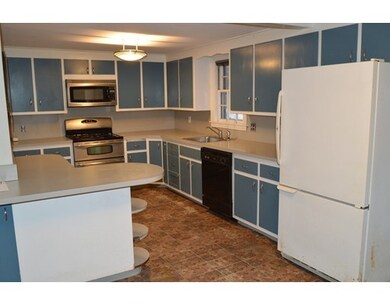
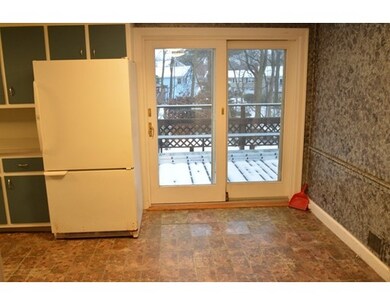
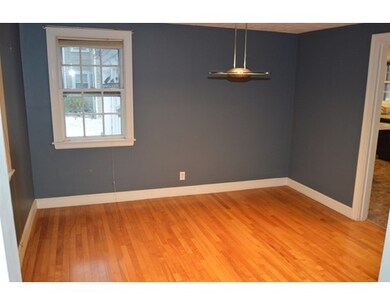
Finally Free To Show Anytime!!!! Beautiful 1,569 Sq ft Needham Single Family Cape WITH CENTRAL AIR AND MODERN FEATURES. Cosmetics Needed. This property sits on 10,000 sq ft of land. Garage Parking. Private Rear Yard . Steps from Echo Bridge and Elliot MBTA Station. This is a Post Foreclosure Sale. PROPERTY IS VACANT. CASH ONLY!!! GOOD FOR INVESTORS / DEVELOPERS. Don't miss this opportunity!!!
Home Type
Single Family
Est. Annual Taxes
$15,839
Year Built
1946
Lot Details
0
| Date | Type | Sale Price | Title Company |
|---|---|---|---|
| Foreclosure Deed | $439,000 | -- | |
| Not Resolvable | $1,025,000 | -- | |
| Deed | -- | -- | |
| Foreclosure Deed | $439,000 | -- | |
| Deed | -- | -- | |
| Deed | $260,000 | -- | |
| Deed | $199,000 | -- | |
| Deed | $192,500 | -- |
| Date | Status | Loan Amount | Loan Type |
|---|---|---|---|
| Open | $770,000 | Unknown | |
| Previous Owner | $264,000 | No Value Available | |
| Previous Owner | $40,000 | No Value Available | |
| Previous Owner | $234,000 | Purchase Money Mortgage |
| Date | Event | Price | Change | Sq Ft Price |
|---|---|---|---|---|
| 09/06/2017 09/06/17 | Sold | $1,025,000 | -10.9% | $312 / Sq Ft |
| 07/31/2017 07/31/17 | Pending | -- | -- | -- |
| 07/28/2017 07/28/17 | Price Changed | $1,150,000 | -4.0% | $350 / Sq Ft |
| 07/07/2017 07/07/17 | Price Changed | $1,198,000 | -3.8% | $365 / Sq Ft |
| 06/10/2017 06/10/17 | Price Changed | $1,245,000 | -3.5% | $379 / Sq Ft |
| 05/15/2017 05/15/17 | Price Changed | $1,290,000 | -4.1% | $393 / Sq Ft |
| 05/04/2017 05/04/17 | Price Changed | $1,345,000 | -1.8% | $410 / Sq Ft |
| 04/20/2017 04/20/17 | For Sale | $1,370,000 | +194.6% | $417 / Sq Ft |
| 02/26/2016 02/26/16 | Sold | $465,000 | -10.4% | $296 / Sq Ft |
| 02/02/2016 02/02/16 | Pending | -- | -- | -- |
| 01/22/2016 01/22/16 | Price Changed | $519,000 | +7.5% | $331 / Sq Ft |
| 01/06/2016 01/06/16 | Price Changed | $483,000 | -1.0% | $308 / Sq Ft |
| 12/21/2015 12/21/15 | Price Changed | $488,000 | -0.2% | $311 / Sq Ft |
| 12/17/2015 12/17/15 | Price Changed | $488,900 | 0.0% | $312 / Sq Ft |
| 12/01/2015 12/01/15 | Price Changed | $489,000 | -1.8% | $312 / Sq Ft |
| 12/01/2015 12/01/15 | Price Changed | $498,000 | -0.2% | $317 / Sq Ft |
| 11/16/2015 11/16/15 | For Sale | $499,000 | -- | $318 / Sq Ft |
| Year | Tax Paid | Tax Assessment Tax Assessment Total Assessment is a certain percentage of the fair market value that is determined by local assessors to be the total taxable value of land and additions on the property. | Land | Improvement |
|---|---|---|---|---|
| 2025 | $15,839 | $1,494,200 | $670,300 | $823,900 |
| 2024 | $15,632 | $1,248,600 | $408,400 | $840,200 |
| 2023 | $15,312 | $1,174,200 | $408,400 | $765,800 |
| 2022 | $14,551 | $1,088,300 | $364,700 | $723,600 |
| 2021 | $14,181 | $1,088,300 | $364,700 | $723,600 |
| 2020 | $13,845 | $1,108,500 | $364,700 | $743,800 |
| 2019 | $13,116 | $1,058,600 | $331,500 | $727,100 |
| 2018 | $12,576 | $1,058,600 | $331,500 | $727,100 |
| 2017 | $5,598 | $470,800 | $331,500 | $139,300 |
| 2016 | $5,455 | $472,700 | $331,500 | $141,200 |
| 2015 | $5,337 | $472,700 | $331,500 | $141,200 |
| 2014 | $4,925 | $423,100 | $325,000 | $98,100 |
C
Seller's Agent in 2017
Chau Uong
Keller Williams Realty

Buyer's Agent in 2017
Femion Mezini
Capital Realty Group
(508) 801-7122
153 Total Sales
Seller's Agent in 2016
Jerome Bibuld
Red Tree Real Estate
(617) 642-5456
2 in this area
93 Total Sales
Buyer's Agent in 2016
Adam Kotkin
Red Tree Real Estate
(617) 694-7356
38 Total Sales
Source: MLS Property Information Network (MLS PIN)
MLS Number: 71933082
APN: NEED-000087-000044
Disclaimer: Certain information contained herein is derived from information provided by parties other than Homes.com. All information provided is deemed reliable, but is not guaranteed to be accurate and should be independently verified.
![]() The property listing data and information, or the Images, set forth herein were provided to MLS Property Information Network, Inc. from third party sources, including sellers, lessors and public records, and were compiled by MLS Property Information Network, Inc. The property listing data and information, and the Images, are for the personal, non-commercial use of consumers having a good faith interest in purchasing or leasing listed properties of the type displayed to them and may not be used for any purpose other than to identify prospective properties which such consumers may have a good faith interest in purchasing or leasing. MLS Property Information Network, Inc. and its subscribers disclaim any and all representations and warranties as to the accuracy of the property listing data and information, or as to the accuracy of any of the Images, set forth herein.
The property listing data and information, or the Images, set forth herein were provided to MLS Property Information Network, Inc. from third party sources, including sellers, lessors and public records, and were compiled by MLS Property Information Network, Inc. The property listing data and information, and the Images, are for the personal, non-commercial use of consumers having a good faith interest in purchasing or leasing listed properties of the type displayed to them and may not be used for any purpose other than to identify prospective properties which such consumers may have a good faith interest in purchasing or leasing. MLS Property Information Network, Inc. and its subscribers disclaim any and all representations and warranties as to the accuracy of the property listing data and information, or as to the accuracy of any of the Images, set forth herein.