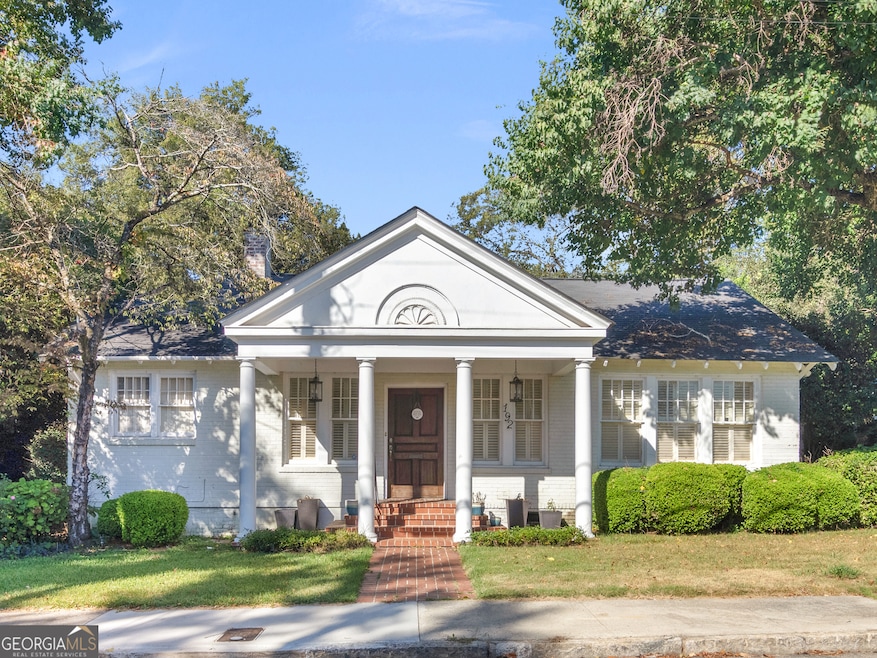
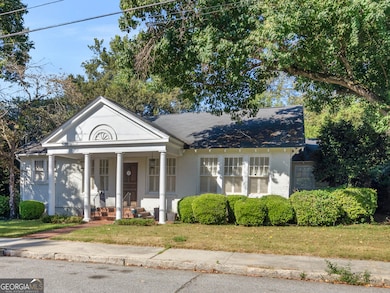
192 Corbin Ave Macon, GA 31204
Vineville Historic District NeighborhoodEstimated payment $1,707/month
Highlights
- Ranch Style House
- 1 Fireplace
- No HOA
- Wood Flooring
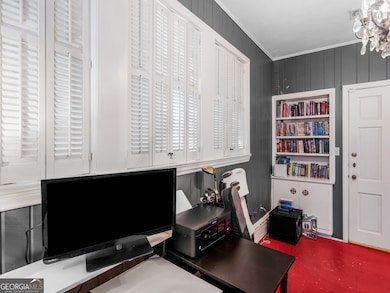
- Bonus Room
- Brick Front
About This Home
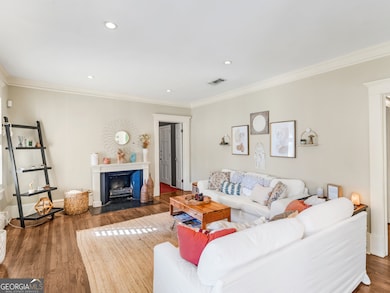
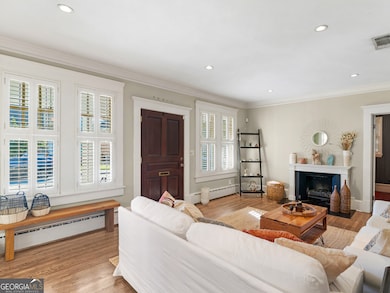
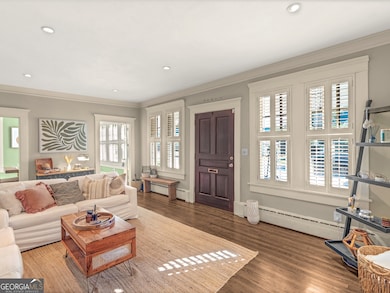
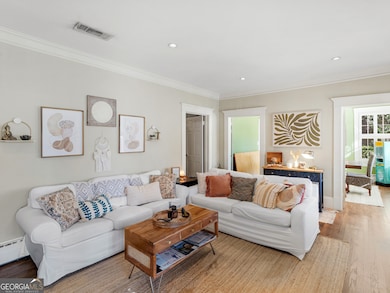
Welcome to 192 Corbin Ave!! Built in 1950, this home offers over 2100 sqft of living space that is well equipped with modern and charming finishes that will transport you back with its beautiful hardwood floors, built ins, and amazing tiled bathrooms just to name a few. See for yourself before this one is snatched up.
Home Details
Home Type
- Single Family
Est. Annual Taxes
- $2,573
Year Built
- Built in 1950
Lot Details
- 8,712 Sq Ft Lot
Parking
- Carport
Home Design
- Ranch Style House
- Bungalow
- Composition Roof
- Brick Front
Interior Spaces
- 2,148 Sq Ft Home
- 1 Fireplace
- Bonus Room
- Oven or Range
Flooring
- Wood
- Tile
Bedrooms and Bathrooms
- 4 Main Level Bedrooms
- 2 Full Bathrooms
Schools
- Taylor Elementary School
- Miller Magnet Middle School
- Central High School
Utilities
- Central Heating and Cooling System
- Heating System Uses Natural Gas
- Gas Water Heater
- High Speed Internet
- Cable TV Available
Community Details
- No Home Owners Association
- Hines Terrace Subdivision
Map
Home Values in the Area
Average Home Value in this Area
Tax History
| Year | Tax Paid | Tax Assessment Tax Assessment Total Assessment is a certain percentage of the fair market value that is determined by local assessors to be the total taxable value of land and additions on the property. | Land | Improvement |
|---|---|---|---|---|
| 2025 | $2,573 | $104,711 | $12,000 | $92,711 |
| 2024 | $2,659 | $104,711 | $12,000 | $92,711 |
| 2023 | $2,171 | $80,289 | $12,000 | $68,289 |
| 2022 | $2,846 | $89,214 | $17,100 | $72,114 |
| 2021 | $2,697 | $77,974 | $16,416 | $61,558 |
| 2020 | $2,592 | $73,751 | $16,416 | $57,335 |
| 2019 | $2,448 | $69,528 | $16,416 | $53,112 |
| 2018 | $3,802 | $67,417 | $16,416 | $51,001 |
| 2017 | $2,147 | $67,417 | $16,416 | $51,001 |
| 2016 | $1,749 | $57,565 | $16,416 | $41,149 |
| 2015 | $2,477 | $57,565 | $16,416 | $41,149 |
| 2014 | $2,900 | $57,565 | $16,416 | $41,149 |
Property History
| Date | Event | Price | List to Sale | Price per Sq Ft |
|---|---|---|---|---|
| 12/31/2025 12/31/25 | Price Changed | $289,900 | -2.2% | $135 / Sq Ft |
| 11/10/2025 11/10/25 | Price Changed | $296,500 | -1.1% | $138 / Sq Ft |
| 10/07/2025 10/07/25 | For Sale | $299,900 | -- | $140 / Sq Ft |
Purchase History
| Date | Type | Sale Price | Title Company |
|---|---|---|---|
| Special Warranty Deed | $289,900 | -- | |
| Warranty Deed | $174,500 | -- | |
| Warranty Deed | $137,000 | -- | |
| Warranty Deed | $121,000 | -- |
Mortgage History
| Date | Status | Loan Amount | Loan Type |
|---|---|---|---|
| Open | $235,978 | FHA | |
| Previous Owner | $165,775 | New Conventional |
Source: Georgia MLS
MLS Number: 10619910
APN: P071-0329
Disclaimer: Certain information contained herein is derived from information provided by parties other than Homes.com. All information provided is deemed reliable, but is not guaranteed to be accurate and should be independently verified.
![]() The data relating to real estate for sale on this web site comes in part from the Broker Reciprocity Program of Georgia MLS. Real estate listings held by brokerage firms other than Redfin are marked with the Broker Reciprocity logo and detailed information about them includes the name of the listing brokers. Information deemed reliable but not guaranteed. Copyright 2026 Georgia MLS. All rights reserved.
The data relating to real estate for sale on this web site comes in part from the Broker Reciprocity Program of Georgia MLS. Real estate listings held by brokerage firms other than Redfin are marked with the Broker Reciprocity logo and detailed information about them includes the name of the listing brokers. Information deemed reliable but not guaranteed. Copyright 2026 Georgia MLS. All rights reserved.
- 175 Corbin Ave Unit B
- 175 Corbin Ave
- 175 Corbin Ave Unit B
- 175 Corbin Ave Unit A
- 175 Corbin Ave Unit A
- 155 Calloway Dr
- 227 Corbin Ave
- 230 Calloway Dr
- 151 Culver St
- 2155 Ferguson St
- 373 Gaillard St
- 216 Hines Terrace
- 173 Pierce Ave
- 128 Lamar St
- 215 Pierce Ave
- 2129 Roosevelt Ave
- 353 Buford Place
- 173 Cleveland Ave
- 2089 Walnut St
- 362 Buford Place
- 171 Calloway Dr
- 122 Cleveland Ave
- 365 Rogers Ave
- 2529 English Ave
- 2533 English Ave
- 2566 English Ave
- 2375 Parker Ave Unit 2
- 260 Moughon St Unit B
- 347 Grant Ave
- 347 Grant Ave
- 478 Monroe Hill
- 1975 Vineville Ave
- 455 Pursley St
- 1893 3rd Ave
- 1893 3rd Ave Unit B
- 1893 3rd Ave
- 2981 & 2997 Ridge Ave
- 1049 Birch St
- 1930 Northbrook Ave
- 2782 Suwanee Ave

Ask me questions while you tour the home.