Estimated Value: $974,239 - $1,385,000
--
Bed
--
Bath
977
Sq Ft
$1,194/Sq Ft
Est. Value
About This Home
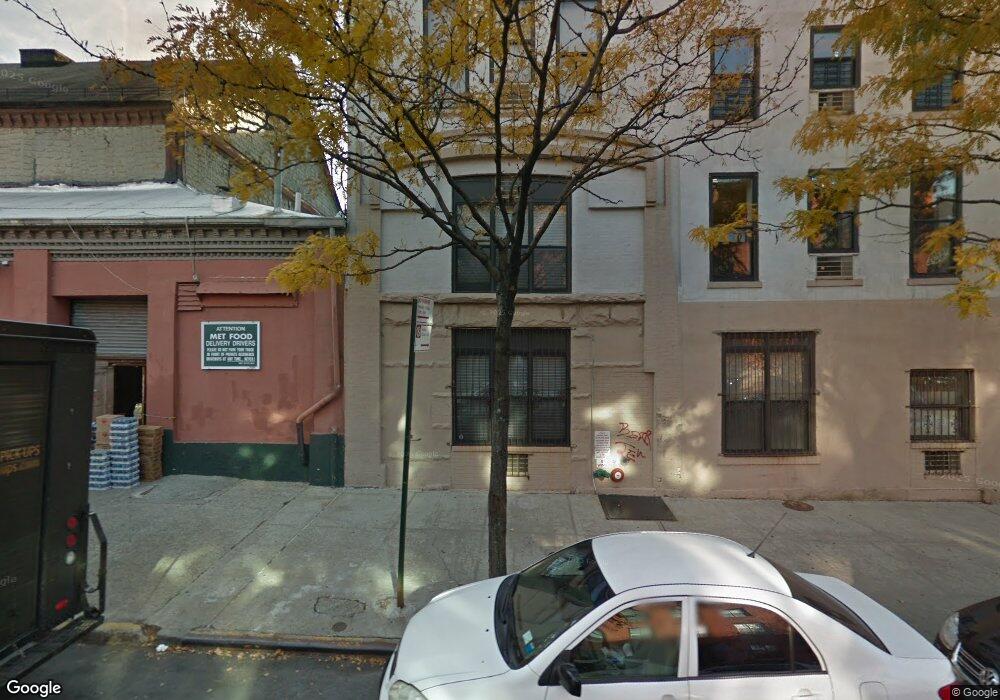
This home is located at 192 Degraw St Unit 1B, Brooklyn, NY 11231 and is currently estimated at $1,166,060, approximately $1,193 per square foot. 192 Degraw St Unit 1B is a home located in Kings County with nearby schools including P.S. 29 John M. Harrigan, Success Academy Cobble Hill, and Brooklyn Heights Montessori School.
Ownership History
Date
Name
Owned For
Owner Type
Purchase Details
Closed on
Sep 8, 2016
Sold by
Cousins 2 Properties Llc
Bought by
Rosenbaum Joshua
Current Estimated Value
Home Financials for this Owner
Home Financials are based on the most recent Mortgage that was taken out on this home.
Original Mortgage
$700,000
Outstanding Balance
$559,133
Interest Rate
3.43%
Mortgage Type
Purchase Money Mortgage
Estimated Equity
$606,927
Purchase Details
Closed on
Jun 5, 2014
Sold by
Mcclafferty Claire E and Mcclafferty John D
Bought by
Cousins 2 Properties Llc
Purchase Details
Closed on
Jul 2, 2004
Sold by
Bertha Eyllon Avia
Bought by
Mcclafferty Claire E and Mcclafferty John D
Home Financials for this Owner
Home Financials are based on the most recent Mortgage that was taken out on this home.
Original Mortgage
$412,000
Interest Rate
6.25%
Mortgage Type
Purchase Money Mortgage
Create a Home Valuation Report for This Property
The Home Valuation Report is an in-depth analysis detailing your home's value as well as a comparison with similar homes in the area
Home Values in the Area
Average Home Value in this Area
Purchase History
| Date | Buyer | Sale Price | Title Company |
|---|---|---|---|
| Rosenbaum Joshua | $900,000 | -- | |
| Cousins 2 Properties Llc | -- | -- | |
| Cousins 2 Properties Llc | -- | -- | |
| Mcclafferty Claire E | $515,000 | -- | |
| Mcclafferty Claire E | $515,000 | -- |
Source: Public Records
Mortgage History
| Date | Status | Borrower | Loan Amount |
|---|---|---|---|
| Open | Rosenbaum Joshua | $700,000 | |
| Previous Owner | Mcclafferty Claire E | $25,750 | |
| Previous Owner | Mcclafferty Claire E | $412,000 |
Source: Public Records
Tax History Compared to Growth
Tax History
| Year | Tax Paid | Tax Assessment Tax Assessment Total Assessment is a certain percentage of the fair market value that is determined by local assessors to be the total taxable value of land and additions on the property. | Land | Improvement |
|---|---|---|---|---|
| 2025 | $5,805 | $57,456 | $2,156 | $55,300 |
| 2024 | $5,805 | $55,342 | $2,156 | $53,186 |
| 2023 | $4,494 | $50,521 | $2,156 | $48,365 |
| 2022 | $4,459 | $49,158 | $2,156 | $47,002 |
| 2021 | $3,854 | $40,543 | $2,156 | $38,387 |
| 2020 | $2,083 | $45,632 | $2,156 | $43,476 |
| 2019 | $4,129 | $45,205 | $2,156 | $43,049 |
| 2018 | $4,694 | $44,179 | $2,156 | $42,023 |
| 2017 | $4,317 | $41,394 | $2,156 | $39,238 |
| 2016 | $4,042 | $32,959 | $2,156 | $30,803 |
| 2015 | $1,879 | $36,627 | $2,157 | $34,470 |
| 2014 | $1,879 | $32,906 | $2,157 | $30,749 |
Source: Public Records
About This Building
Map
Nearby Homes
- 503 Henry St Unit HOUSE
- 54 Cheever Place
- 506 Henry St Unit 4
- 506 Henry St Unit 2
- 506 Henry St Unit PH
- 506 Henry St Unit 3
- 506 Henry St Unit 1
- 178 Sackett St
- 177 Union St Unit 2
- 238 Sackett St
- 60 Tiffany Place Unit 2G
- 139 Sackett St Unit 2
- 130 Degraw St
- 473 Hicks St Unit 4
- 382A Clinton St
- 216 Union St Unit HOUSE
- 216 Union St
- 241 Union St
- 145 President St Unit 6-C
- 145 President St Unit 3-B
- 192 Degraw St Unit 5A
- 192 Degraw St Unit PHC
- 192 Degraw St Unit 6C
- 192 Degraw St Unit 4C
- 192 Degraw St Unit 4B
- 192 Degraw St Unit 4A
- 192 Degraw St Unit 3A
- 192 Degraw St Unit 2F
- 192 Degraw St Unit 2A
- 192 Degraw St Unit 1F
- 192 Degraw St Unit 1D
- 192 Degraw St Unit 6A
- 192 Degraw St Unit 2I
- 192 Degraw St Unit 2H
- 192 Degraw St Unit 1I
- 192 Degraw St Unit 5J
- 192 Degraw St Unit 4I
- 192 Degraw St Unit 3C
- 192 Degraw St Unit 4H
- 192 Degraw St Unit 4D