Estimated Value: $1,075,730 - $1,510,000
--
Bed
--
Bath
1,032
Sq Ft
$1,237/Sq Ft
Est. Value
About This Home
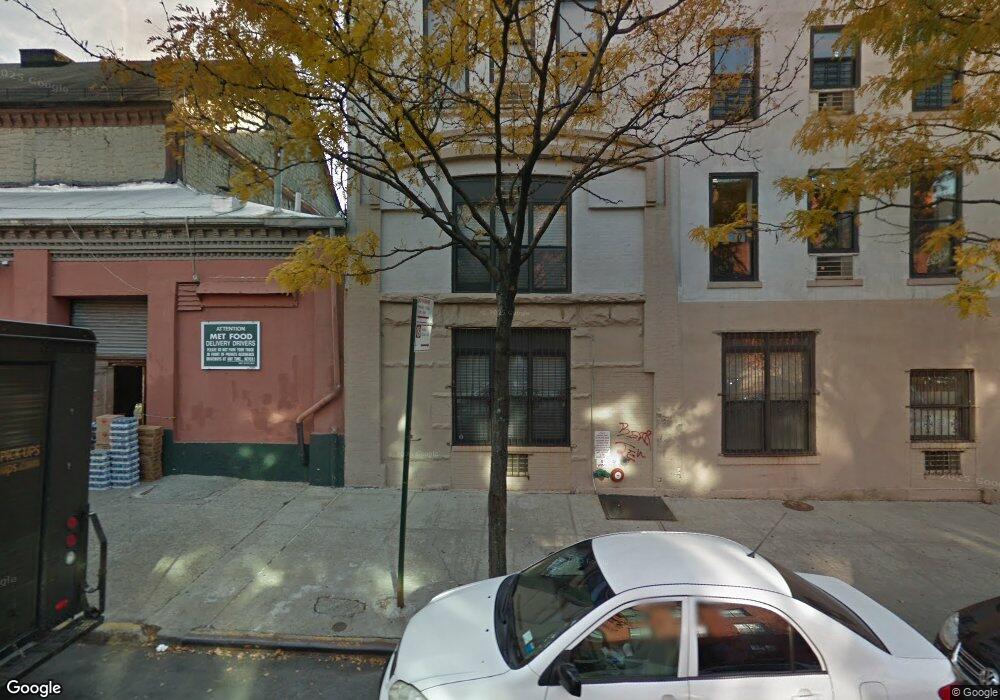
This home is located at 192 Degraw St Unit 2B, Brooklyn, NY 11231 and is currently estimated at $1,276,183, approximately $1,236 per square foot. 192 Degraw St Unit 2B is a home located in Kings County with nearby schools including P.S. 29 John M. Harrigan, Success Academy Cobble Hill, and Brooklyn Heights Montessori School.
Ownership History
Date
Name
Owned For
Owner Type
Purchase Details
Closed on
Jun 15, 2005
Sold by
Mindlin Iliana
Bought by
The Mindlin Family Llc
Current Estimated Value
Purchase Details
Closed on
May 23, 2005
Sold by
Day Charles
Bought by
Mindlin Iliana and Mindlin Philip
Purchase Details
Closed on
Nov 24, 2001
Sold by
Day Charles
Bought by
Day Charles and Wallach Susan
Purchase Details
Closed on
May 17, 2001
Sold by
Ibach Katherine
Bought by
Day Charles and Wallach Susan
Home Financials for this Owner
Home Financials are based on the most recent Mortgage that was taken out on this home.
Original Mortgage
$175,000
Interest Rate
7.15%
Purchase Details
Closed on
Aug 29, 1997
Sold by
Goicochea William
Bought by
Varker Katherine A
Purchase Details
Closed on
Jan 24, 1996
Sold by
Burns Lawrence T
Bought by
Goicochea William
Home Financials for this Owner
Home Financials are based on the most recent Mortgage that was taken out on this home.
Original Mortgage
$153,000
Interest Rate
7.25%
Create a Home Valuation Report for This Property
The Home Valuation Report is an in-depth analysis detailing your home's value as well as a comparison with similar homes in the area
Home Values in the Area
Average Home Value in this Area
Purchase History
| Date | Buyer | Sale Price | Title Company |
|---|---|---|---|
| The Mindlin Family Llc | $675,000 | -- | |
| Mindlin Iliana | $675,000 | -- | |
| Day Charles | -- | -- | |
| Day Charles | -- | -- | |
| Varker Katherine A | $192,000 | -- | |
| Goicochea William | $170,000 | -- |
Source: Public Records
Mortgage History
| Date | Status | Borrower | Loan Amount |
|---|---|---|---|
| Previous Owner | Day Charles | $175,000 | |
| Previous Owner | Goicochea William | $153,000 |
Source: Public Records
Tax History Compared to Growth
Tax History
| Year | Tax Paid | Tax Assessment Tax Assessment Total Assessment is a certain percentage of the fair market value that is determined by local assessors to be the total taxable value of land and additions on the property. | Land | Improvement |
|---|---|---|---|---|
| 2025 | $7,970 | $78,878 | $2,961 | $75,917 |
| 2024 | $7,970 | $75,976 | $2,961 | $73,015 |
| 2023 | $7,622 | $69,359 | $2,961 | $66,398 |
| 2022 | $7,440 | $67,487 | $2,961 | $64,526 |
| 2021 | $6,710 | $55,660 | $2,961 | $52,699 |
| 2020 | $7,120 | $62,647 | $2,961 | $59,686 |
| 2019 | $6,816 | $62,059 | $2,961 | $59,098 |
| 2018 | $6,445 | $60,651 | $2,960 | $57,691 |
| 2017 | $5,927 | $56,828 | $2,961 | $53,867 |
| 2016 | $5,549 | $45,248 | $2,961 | $42,287 |
| 2015 | $2,579 | $50,283 | $2,961 | $47,322 |
| 2014 | $2,579 | $45,175 | $2,961 | $42,214 |
Source: Public Records
About This Building
Map
Nearby Homes
- 503 Henry St Unit HOUSE
- 506 Henry St Unit 2
- 506 Henry St Unit PH
- 506 Henry St Unit 3
- 506 Henry St Unit 1
- 178 Sackett St
- 54 Cheever Place
- 177 Union St Unit 2
- 238 Sackett St
- 382A Clinton St
- 216 Union St Unit HOUSE
- 241 Union St
- 60 Tiffany Place Unit 2G
- 181 President St
- 139 Sackett St Unit 2
- 220 Union St
- 145 President St Unit 6-C
- 145 President St Unit 3-B
- 130 Degraw St
- 230 Union St
- 192 Degraw St Unit 5A
- 192 Degraw St Unit PHC
- 192 Degraw St Unit 6C
- 192 Degraw St Unit 4C
- 192 Degraw St Unit 4B
- 192 Degraw St Unit 4A
- 192 Degraw St Unit 3A
- 192 Degraw St Unit 2F
- 192 Degraw St Unit 2A
- 192 Degraw St Unit 1F
- 192 Degraw St Unit 1D
- 192 Degraw St Unit 1B
- 192 Degraw St Unit 6A
- 192 Degraw St Unit 2I
- 192 Degraw St Unit 2H
- 192 Degraw St Unit 1I
- 192 Degraw St Unit 5J
- 192 Degraw St Unit 4I
- 192 Degraw St Unit 3C
- 192 Degraw St Unit 4H