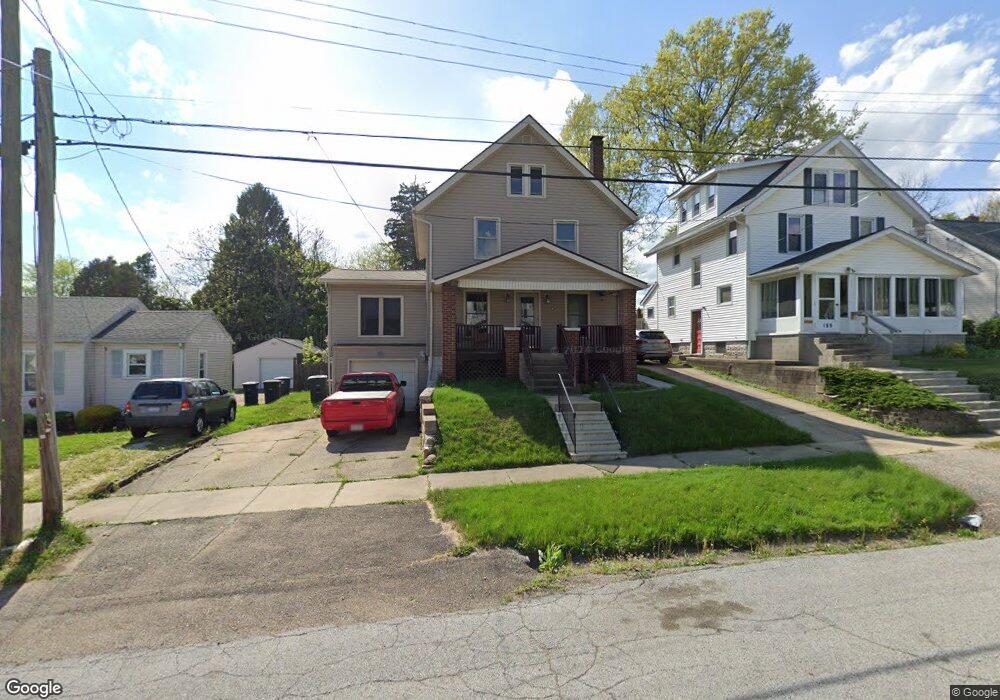
192 Emmons Ave Akron, OH 44312
Ellet NeighborhoodEstimated Value: $177,488 - $207,000
4
Beds
2
Baths
1,650
Sq Ft
$113/Sq Ft
Est. Value
About This Home
This home is located at 192 Emmons Ave, Akron, OH 44312 and is currently estimated at $185,872, approximately $112 per square foot. 192 Emmons Ave is a home located in Summit County with nearby schools including Ellet High School, Summit Academy Akron Elementary School, and Akron Preparatory school.
Ownership History
Date
Name
Owned For
Owner Type
Purchase Details
Closed on
Jun 3, 2024
Sold by
Blacklock Cathy L
Bought by
Brown James R
Current Estimated Value
Purchase Details
Closed on
May 31, 2024
Sold by
Blacklock Cathy L
Bought by
Brown James R
Purchase Details
Closed on
Apr 5, 2023
Sold by
Brown James R
Bought by
Brown James R and Blacklock Cathy L
Purchase Details
Closed on
Apr 1, 2023
Sold by
Brown James R and Blacklock Cathy L
Bought by
Brown James R and Blacklock Cathy L
Purchase Details
Closed on
Apr 8, 2019
Sold by
Brown James R and Blacklock Cathy L
Bought by
Brown James R and Blacklock Cathy L
Purchase Details
Closed on
Oct 24, 2018
Sold by
Brown James R
Bought by
Brown James R and Blacklock Cathy L
Purchase Details
Closed on
Aug 25, 2004
Sold by
Blacklock Cathy L
Bought by
Brown James R
Create a Home Valuation Report for This Property
The Home Valuation Report is an in-depth analysis detailing your home's value as well as a comparison with similar homes in the area
Home Values in the Area
Average Home Value in this Area
Purchase History
| Date | Buyer | Sale Price | Title Company |
|---|---|---|---|
| Brown James R | -- | None Listed On Document | |
| Brown James R | -- | None Listed On Document | |
| Brown James R | $36,250 | None Listed On Document | |
| Brown James R | $36,250 | None Listed On Document | |
| Brown James R | -- | Kingdom Title | |
| Brown James R | -- | None Available | |
| Brown James R | -- | Landamerica Laywers Title |
Source: Public Records
Tax History Compared to Growth
Tax History
| Year | Tax Paid | Tax Assessment Tax Assessment Total Assessment is a certain percentage of the fair market value that is determined by local assessors to be the total taxable value of land and additions on the property. | Land | Improvement |
|---|---|---|---|---|
| 2025 | $2,183 | $50,254 | $9,426 | $40,828 |
| 2024 | $2,183 | $50,254 | $9,426 | $40,828 |
| 2023 | $2,183 | $50,254 | $9,426 | $40,828 |
| 2022 | $1,988 | $38,070 | $7,140 | $30,930 |
| 2021 | $1,990 | $38,070 | $7,140 | $30,930 |
| 2020 | $1,960 | $38,070 | $7,140 | $30,930 |
| 2019 | $1,476 | $28,520 | $6,500 | $22,020 |
| 2018 | $1,456 | $28,520 | $6,500 | $22,020 |
| 2017 | $1,284 | $28,520 | $6,500 | $22,020 |
| 2016 | $1,285 | $25,760 | $6,500 | $19,260 |
| 2015 | $1,284 | $25,760 | $6,500 | $19,260 |
| 2014 | $1,274 | $25,760 | $6,500 | $19,260 |
| 2013 | $1,395 | $27,900 | $6,500 | $21,400 |
Source: Public Records
Map
Nearby Homes
- 172 Emmons Ave
- 195 Prairie Dr
- 57 Carlton Dr
- 2258 Mogadore Rd
- 2382 Mogadore Rd
- 181 Hilbish Ave
- 218 Canton Rd
- 198 Hilbish Ave
- 159 Dellenberger Ave
- 1955 Preston Ave Unit 1957
- 1947 Preston Ave Unit 1949
- 428 Seaman Ave
- 2076 Congo St
- 452 Herbert Rd
- 404 Newell Ave
- 364 Stanley Rd
- 333 Cluster Ave
- 1892 Malasia Rd
- 179 Davenport Ave
- 274 Fulmer Ave
- 198 Emmons Ave
- 188 Emmons Ave
- 202 Emmons Ave
- 182 Emmons Ave
- 191 Edgehill Dr
- 195 Edgehill Dr
- 206 Emmons Ave
- 185 Edgehill Dr
- 178 Emmons Ave
- 199 Edgehill Dr
- 179 Edgehill Dr
- 195 Emmons Ave
- 185 Emmons Ave
- 201 Emmons Ave
- 2285 E Market St
- 2281 E Market St
- 205 Emmons Ave
- 2293 E Market St
- 2271 E Market St
- 168 Emmons Ave