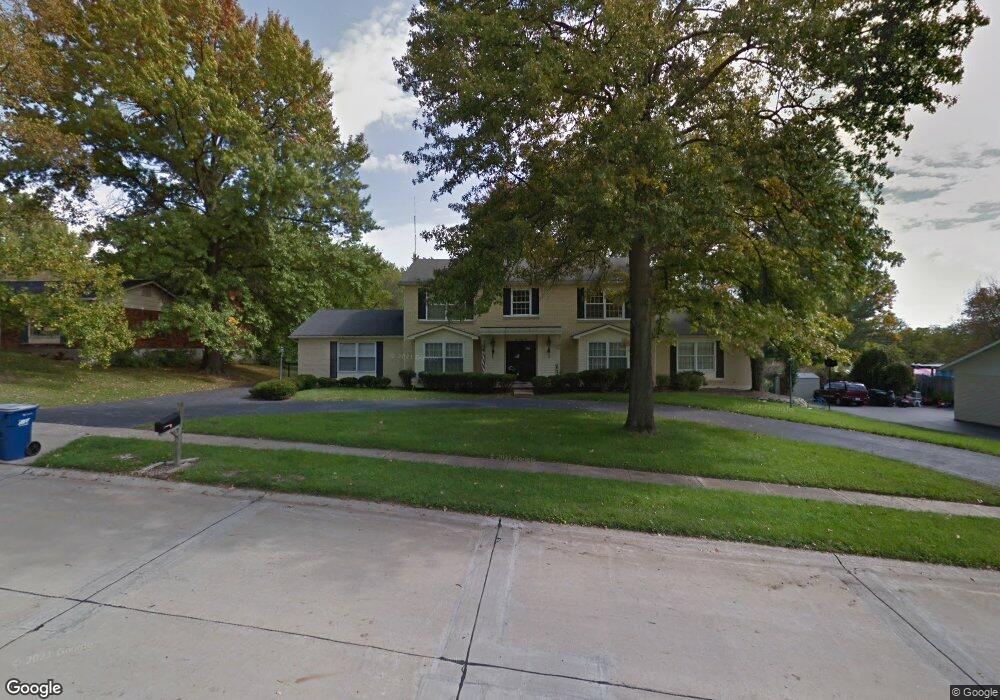
192 Greentrails Dr N Chesterfield, MO 63017
Estimated Value: $545,000 - $654,000
--
Bed
4
Baths
3,180
Sq Ft
$194/Sq Ft
Est. Value
About This Home
This home is located at 192 Greentrails Dr N, Chesterfield, MO 63017 and is currently estimated at $615,705, approximately $193 per square foot. 192 Greentrails Dr N is a home located in St. Louis County with nearby schools including Green Trails Elementary School, Parkway Central Middle School, and Parkway Central High School.
Ownership History
Date
Name
Owned For
Owner Type
Purchase Details
Closed on
Feb 6, 2020
Sold by
Winter Chaim Dov and Winter Adina Winter
Bought by
Winter Chaim Dov and Winter Adina
Current Estimated Value
Home Financials for this Owner
Home Financials are based on the most recent Mortgage that was taken out on this home.
Original Mortgage
$265,000
Outstanding Balance
$235,172
Interest Rate
3.72%
Mortgage Type
New Conventional
Estimated Equity
$380,533
Purchase Details
Closed on
Jul 5, 2019
Sold by
Winter Chaim D and Winter Adina
Bought by
Winter Chaim Dov and Winter Adina
Purchase Details
Closed on
Mar 2, 2011
Sold by
Hartstein Jack and Hartstein Merle Ruth
Bought by
Winter Chaim D and Winter Adina
Home Financials for this Owner
Home Financials are based on the most recent Mortgage that was taken out on this home.
Original Mortgage
$228,000
Interest Rate
4.73%
Mortgage Type
New Conventional
Create a Home Valuation Report for This Property
The Home Valuation Report is an in-depth analysis detailing your home's value as well as a comparison with similar homes in the area
Home Values in the Area
Average Home Value in this Area
Purchase History
| Date | Buyer | Sale Price | Title Company |
|---|---|---|---|
| Winter Chaim Dov | -- | Freedom Title Llc St Louis | |
| Winter Chaim Dov | -- | Freedom Title Llc St Louis | |
| Winter Chaim Dov | -- | None Available | |
| Winter Chaim D | $285,000 | None Available |
Source: Public Records
Mortgage History
| Date | Status | Borrower | Loan Amount |
|---|---|---|---|
| Open | Winter Chaim Dov | $265,000 | |
| Closed | Winter Chaim D | $228,000 |
Source: Public Records
Tax History Compared to Growth
Tax History
| Year | Tax Paid | Tax Assessment Tax Assessment Total Assessment is a certain percentage of the fair market value that is determined by local assessors to be the total taxable value of land and additions on the property. | Land | Improvement |
|---|---|---|---|---|
| 2025 | $6,838 | $118,520 | $47,840 | $70,680 |
| 2024 | $6,838 | $103,500 | $30,460 | $73,040 |
| 2023 | $6,558 | $103,500 | $30,460 | $73,040 |
| 2022 | $5,546 | $79,590 | $30,460 | $49,130 |
| 2021 | $5,523 | $79,590 | $30,460 | $49,130 |
| 2020 | $5,434 | $75,210 | $26,110 | $49,100 |
| 2019 | $5,316 | $75,210 | $26,110 | $49,100 |
| 2018 | $5,386 | $70,680 | $23,810 | $46,870 |
| 2017 | $5,240 | $70,680 | $23,810 | $46,870 |
| 2016 | $5,223 | $66,960 | $19,570 | $47,390 |
| 2015 | $5,476 | $66,960 | $19,570 | $47,390 |
| 2014 | $4,914 | $64,240 | $13,070 | $51,170 |
Source: Public Records
Map
Nearby Homes
- 14257 Forest Crest Dr
- 14327 Bramblewood Ct
- 240 Greentrails Dr S
- 14036 Agusta Dr
- 14121 Westernmill Dr
- 384 Greentrails Dr S
- 85 Glen Cove Dr
- 609 Spyglass Summit Dr
- 56 Forest Crest Dr
- 76 Glen Cove Dr
- 621 Old Riverwoods Ln
- 14361 White Birch Valley Ln
- 214 Cordovan Commons Pkwy
- 14312 Spyglass Ridge
- 14316 Spyglass Ridge
- 14560 White Birch Valley Ln
- 232 Cordovan Commons Pkwy
- 162 New Holland Dr
- 445 Whitestone Farm Dr
- 153 Kendall Bluff Ct
- 202 Greentrails Dr N
- 182 Greentrails Dr N
- 172 Greentrails Dr N
- 214 Greentrails Dr N
- 193 Greentrails Dr N
- 201 Greentrails Dr N
- 177 Seabrook Dr
- 167 Seabrook Dr
- 226 Greentrails Dr N
- 213 Greentrails Dr N
- 185 Seabrook Dr
- 186 Stablestone Dr
- 157 Seabrook Dr
- 171 Stablestone Dr
- 140 Greentrails Dr N
- 227 Greentrails Dr N
- 238 Greentrails Dr N
- 14300 Bramblewood Ct
- 197 Seabrook Dr
- 245 Greentrails Dr N