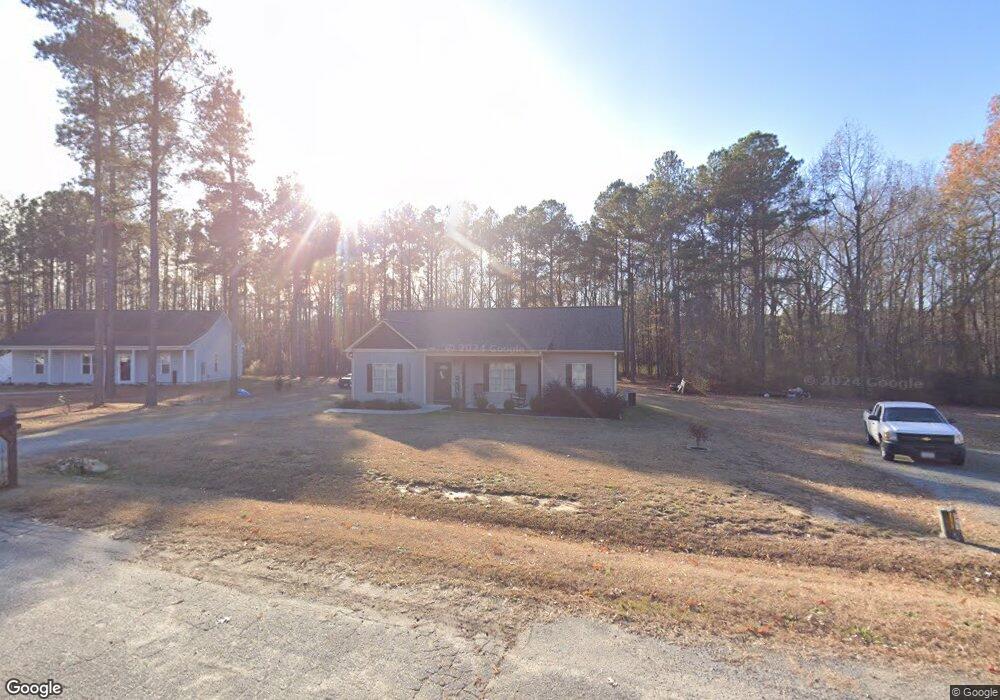
192 Jon Dr Unit 46R Smithfield, NC 27577
Estimated Value: $253,000 - $282,000
3
Beds
2
Baths
1,192
Sq Ft
$223/Sq Ft
Est. Value
About This Home
This home is located at 192 Jon Dr Unit 46R, Smithfield, NC 27577 and is currently estimated at $265,477, approximately $222 per square foot. 192 Jon Dr Unit 46R is a home located in Johnston County with nearby schools including West Smithfield Elementary School, Smithfield Middle School, and Smithfield-Selma High School.
Ownership History
Date
Name
Owned For
Owner Type
Purchase Details
Closed on
Nov 15, 2018
Sold by
Js & S Development Inc
Bought by
Pina Wilmer Ceballos and Carmenaty Milly
Current Estimated Value
Home Financials for this Owner
Home Financials are based on the most recent Mortgage that was taken out on this home.
Original Mortgage
$135,703
Outstanding Balance
$119,080
Interest Rate
4.7%
Mortgage Type
New Conventional
Estimated Equity
$146,397
Create a Home Valuation Report for This Property
The Home Valuation Report is an in-depth analysis detailing your home's value as well as a comparison with similar homes in the area
Home Values in the Area
Average Home Value in this Area
Purchase History
| Date | Buyer | Sale Price | Title Company |
|---|---|---|---|
| Pina Wilmer Ceballos | $140,000 | None Available |
Source: Public Records
Mortgage History
| Date | Status | Borrower | Loan Amount |
|---|---|---|---|
| Open | Pina Wilmer Ceballos | $135,703 |
Source: Public Records
Tax History
| Year | Tax Paid | Tax Assessment Tax Assessment Total Assessment is a certain percentage of the fair market value that is determined by local assessors to be the total taxable value of land and additions on the property. | Land | Improvement |
|---|---|---|---|---|
| 2025 | $1,603 | $252,490 | $56,100 | $196,390 |
| 2024 | $1,048 | $129,430 | $29,580 | $99,850 |
| 2023 | $1,048 | $129,430 | $29,580 | $99,850 |
| 2022 | $1,074 | $129,430 | $29,580 | $99,850 |
| 2021 | $1,074 | $129,430 | $29,580 | $99,850 |
| 2020 | $1,087 | $129,430 | $29,580 | $99,850 |
| 2019 | $1,087 | $129,430 | $29,580 | $99,850 |
| 2018 | $660 | $76,720 | $24,990 | $51,730 |
| 2017 | $215 | $24,990 | $24,990 | $0 |
| 2016 | $215 | $24,990 | $24,990 | $0 |
| 2015 | $215 | $24,990 | $24,990 | $0 |
| 2014 | $215 | $24,990 | $24,990 | $0 |
Source: Public Records
Map
Nearby Homes
- 224 Cherokee Cir
- 41 Clipper Ln
- 207 Tuskeegee Dr Unit (Lot 42)
- 207 Tuskeegee Dr
- 136 Tuskeegee Dr Unit (Lot 38)
- 136 Tuskeegee Dr
- 108 Tuskeegee Dr Unit (Lot 37)
- 108 Tuskeegee Dr
- 187 Tuskeegee Dr
- 187 Tuskeegee Dr Unit (Lot 44)
- 213 Yardley Dr Unit (Lot 68)
- 139 Yardley Dr Unit (Lot 74)
- 203 Yardley Dr
- 203 Yardley Dr Unit (Lot 69)
- 139 Yardley Dr
- 262 Yardley Dr Unit (Lot 64)
- 262 Yardley Dr
- 252 Yardley Dr
- 202 Yardley Dr
- 213 Yardley Dr
Your Personal Tour Guide
Ask me questions while you tour the home.