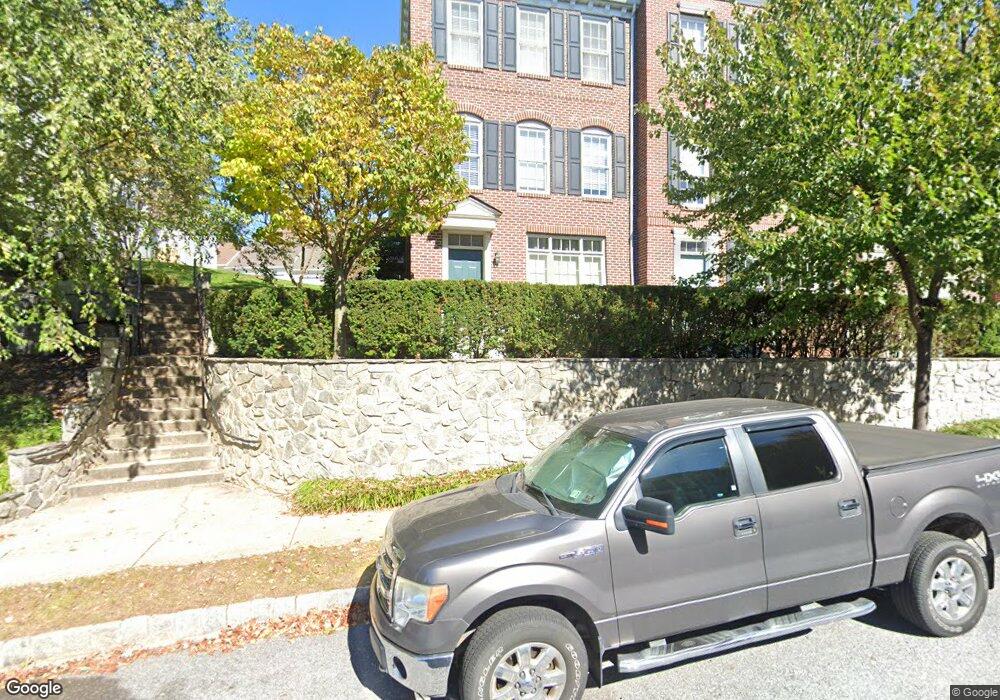
192 N Melhorn Dr Unit 73 Mount Joy, PA 17552
Estimated Value: $312,218 - $351,000
3
Beds
3
Baths
1,340
Sq Ft
$246/Sq Ft
Est. Value
About This Home
This home is located at 192 N Melhorn Dr Unit 73, Mount Joy, PA 17552 and is currently estimated at $330,055, approximately $246 per square foot. 192 N Melhorn Dr Unit 73 is a home located in Lancaster County with nearby schools including Donegal Intermediate School, Donegal High School, and KELLY SCHOOL.
Ownership History
Date
Name
Owned For
Owner Type
Purchase Details
Closed on
Aug 18, 2023
Sold by
Celline Vincent A and Celline Anita Y
Bought by
Obuobisa Maxwell J
Current Estimated Value
Home Financials for this Owner
Home Financials are based on the most recent Mortgage that was taken out on this home.
Original Mortgage
$244,000
Outstanding Balance
$238,593
Interest Rate
6.96%
Mortgage Type
New Conventional
Estimated Equity
$91,462
Purchase Details
Closed on
Oct 1, 2012
Sold by
Zito Matthew J
Bought by
Celline Vincent A and Celline Anita Y
Purchase Details
Closed on
Nov 27, 2006
Sold by
Charter Homes At Florin Hill Inc
Bought by
Zito Matthew J
Home Financials for this Owner
Home Financials are based on the most recent Mortgage that was taken out on this home.
Original Mortgage
$30,000
Interest Rate
6.36%
Mortgage Type
Stand Alone Second
Create a Home Valuation Report for This Property
The Home Valuation Report is an in-depth analysis detailing your home's value as well as a comparison with similar homes in the area
Home Values in the Area
Average Home Value in this Area
Purchase History
| Date | Buyer | Sale Price | Title Company |
|---|---|---|---|
| Obuobisa Maxwell J | $300,000 | None Listed On Document | |
| Celline Vincent A | $175,000 | None Available | |
| Zito Matthew J | -- | None Available |
Source: Public Records
Mortgage History
| Date | Status | Borrower | Loan Amount |
|---|---|---|---|
| Open | Obuobisa Maxwell J | $244,000 | |
| Previous Owner | Zito Matthew J | $30,000 | |
| Previous Owner | Zito Matthew J | $160,000 |
Source: Public Records
Tax History Compared to Growth
Tax History
| Year | Tax Paid | Tax Assessment Tax Assessment Total Assessment is a certain percentage of the fair market value that is determined by local assessors to be the total taxable value of land and additions on the property. | Land | Improvement |
|---|---|---|---|---|
| 2025 | $4,768 | $178,200 | -- | $178,200 |
| 2024 | $4,768 | $178,200 | -- | $178,200 |
| 2023 | $4,629 | $178,200 | $0 | $178,200 |
| 2022 | $4,629 | $178,200 | $0 | $178,200 |
| 2021 | $4,506 | $178,200 | $0 | $178,200 |
| 2020 | $4,506 | $178,200 | $0 | $178,200 |
| 2019 | $4,425 | $178,200 | $0 | $178,200 |
| 2018 | $3,109 | $178,200 | $0 | $178,200 |
| 2017 | $4,016 | $129,100 | $0 | $129,100 |
| 2016 | $4,016 | $129,100 | $0 | $129,100 |
| 2015 | $1,116 | $129,100 | $0 | $129,100 |
| 2014 | $2,714 | $129,100 | $0 | $129,100 |
Source: Public Records
Map
Nearby Homes
- Carter Plan at Florin Hill - Single Family
- Dundee Plan at Florin Hill - Single Family
- Marlow Plan at Florin Hill - Single Family
- Elgin Plan at Florin Hill - Single Family
- Andover Plan at Florin Hill - Single Family
- Anders Plan at Florin Hill - Single Family
- Darby Plan at Florin Hill - Single Family
- Arundel Plan at Florin Hill - Single Family
- Bromley Plan at Florin Hill - Single Family
- Helston Plan at Florin Hill - Single Family
- 104 Merchant Ave Unit ANDOVER
- 104 Merchant Ave Unit MARLOW
- 104 Merchant Ave Unit ELGIN
- 104 Merchant Ave Unit DUNDEE
- 104 Merchant Ave Unit ANDERS
- 104 Merchant Ave Unit ARUNDEL
- 104 Merchant Ave Unit CARTER
- 104 Merchant Ave Unit HELSTON
- 104 Merchant Ave Unit BROMLEY
- 104 Merchant Ave Unit DARBY
- 192 N Melhorn Dr
- 196 N Melhorn Dr
- 196 N Melhorn Dr Unit 68
- 188 N Melhorn Dr
- 198 N Melhorn Dr
- 186 N Melhorn Dr
- 186 N Melhorn Dr Unit 64 - TBB
- 200 N Melhorn Dr
- 184 N Melhorn Dr
- 182 N Melhorn Dr
- 202 N Melhorn Dr Unit 71
- 214 Sagamore Hill
- 210 Sagamore Hill
- 210 Sagamore Hill Unit 56
- 212 Sagamore Hill
- 212 Sagamore Hill Unit 55
- 204 N Melhorn Dr Unit 72
- 216 Sagamore Hill
- 216 Sagamore Hill Unit 53
- 208 Sagamore Hill Unit 57