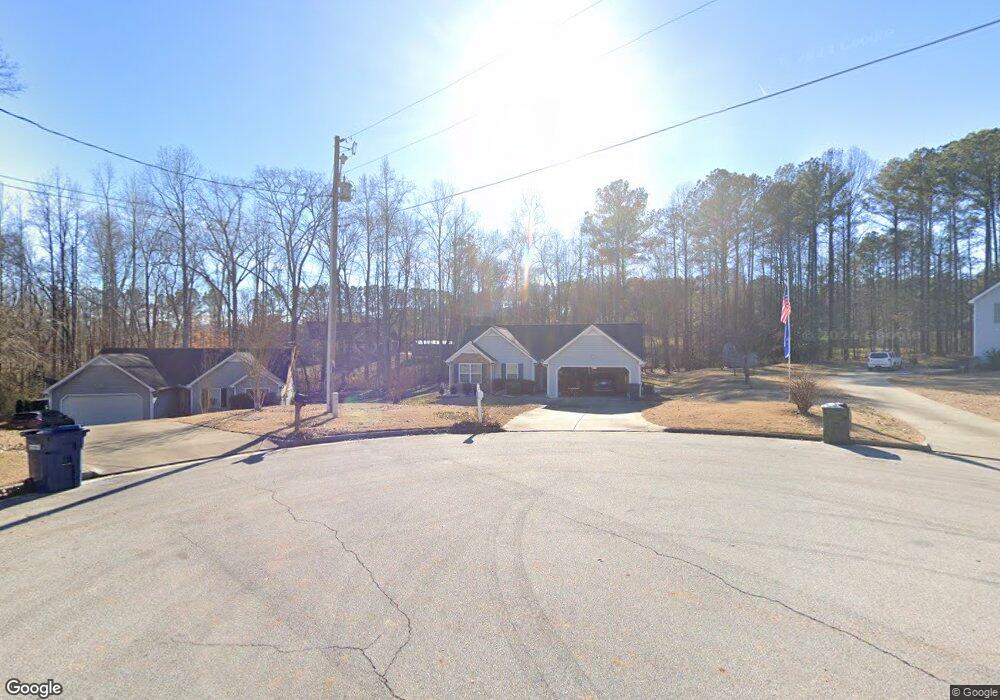
192 Noah Dr Rockmart, GA 30153
Estimated Value: $247,000 - $275,000
3
Beds
2
Baths
1,145
Sq Ft
$228/Sq Ft
Est. Value
About This Home
This home is located at 192 Noah Dr, Rockmart, GA 30153 and is currently estimated at $260,630, approximately $227 per square foot. 192 Noah Dr is a home located in Paulding County with nearby schools including Sara M. Ragsdale Elementary School, Carl Scoggins Sr. Middle School, and South Paulding High School.
Ownership History
Date
Name
Owned For
Owner Type
Purchase Details
Closed on
Oct 28, 2011
Sold by
Hsbc Bank Usa National Ass
Bought by
Brooks Ronald C
Current Estimated Value
Home Financials for this Owner
Home Financials are based on the most recent Mortgage that was taken out on this home.
Original Mortgage
$35,920
Outstanding Balance
$24,577
Interest Rate
4.09%
Mortgage Type
New Conventional
Estimated Equity
$236,053
Purchase Details
Closed on
Mar 15, 2007
Sold by
Obryant Gary R
Bought by
Quality Homes
Create a Home Valuation Report for This Property
The Home Valuation Report is an in-depth analysis detailing your home's value as well as a comparison with similar homes in the area
Home Values in the Area
Average Home Value in this Area
Purchase History
| Date | Buyer | Sale Price | Title Company |
|---|---|---|---|
| Brooks Ronald C | $44,900 | -- | |
| Quality Homes | $8,500 | -- |
Source: Public Records
Mortgage History
| Date | Status | Borrower | Loan Amount |
|---|---|---|---|
| Open | Brooks Ronald C | $35,920 |
Source: Public Records
Tax History Compared to Growth
Tax History
| Year | Tax Paid | Tax Assessment Tax Assessment Total Assessment is a certain percentage of the fair market value that is determined by local assessors to be the total taxable value of land and additions on the property. | Land | Improvement |
|---|---|---|---|---|
| 2024 | -- | $90,960 | $12,000 | $78,960 |
| 2023 | $0 | $90,864 | $12,000 | $78,864 |
| 2022 | $2,277 | $76,652 | $12,000 | $64,652 |
| 2021 | $1,714 | $57,708 | $6,000 | $51,708 |
| 2020 | $1,649 | $55,520 | $6,000 | $49,520 |
| 2019 | $1,540 | $51,120 | $6,000 | $45,120 |
| 2018 | $0 | $41,640 | $6,000 | $35,640 |
| 2017 | $0 | $35,640 | $6,000 | $29,640 |
| 2016 | $629 | $36,960 | $6,000 | $30,960 |
| 2015 | $368 | $23,932 | $6,000 | $17,932 |
| 2014 | $340 | $22,024 | $6,000 | $16,024 |
| 2013 | -- | $20,080 | $6,000 | $14,080 |
Source: Public Records
Map
Nearby Homes
- 46 Noah Dr
- 464 Pleasant Grove Rd
- 3002 Highway 101 N
- 184 Gamel Rd
- 234 Gamel Rd
- 2117 Georgia 101
- 39 Rosemary Path
- 53 Grove Ln
- 138 Pleasant Dr
- 143 Delane Dr
- 230 Galvin Trail
- 1736 Pleasant Grove Rd
- 1174 Proctor Rd
- 298 Randall Dr
- 295 Miller Path
- 174 Randall Dr
- 53 Adams Ln
- 3639 Holly Springs Rd
- 219 Carthage Blvd
- 316 White Creek Loop