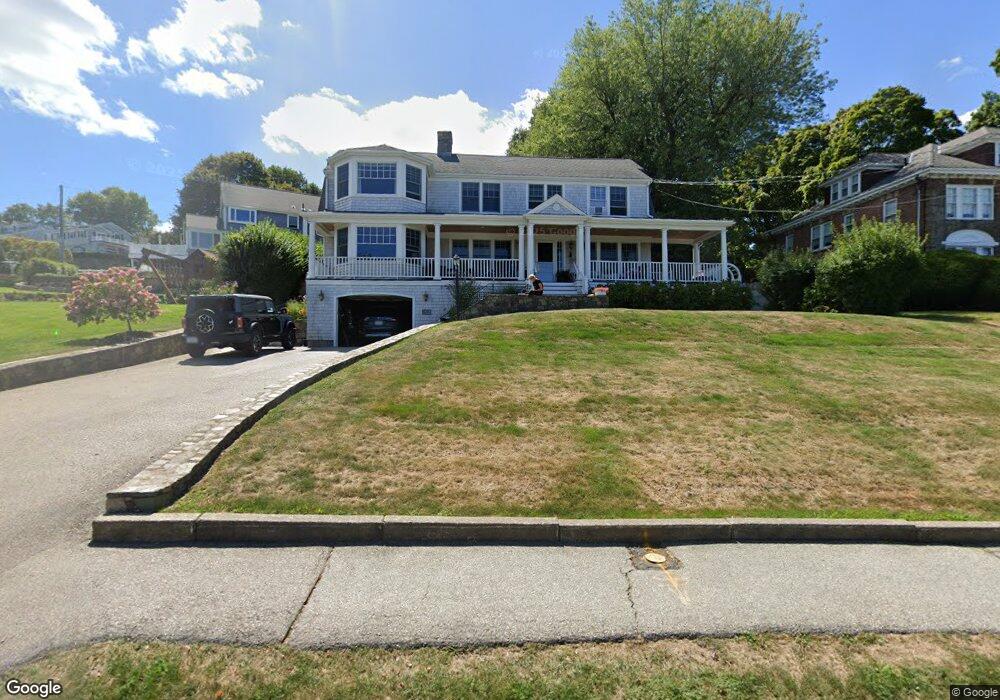
192 Otis St Hingham, MA 02043
Crow Point NeighborhoodEstimated Value: $2,056,000 - $2,590,000
4
Beds
2
Baths
2,738
Sq Ft
$844/Sq Ft
Est. Value
About This Home
This home is located at 192 Otis St, Hingham, MA 02043 and is currently estimated at $2,311,904, approximately $844 per square foot. 192 Otis St is a home located in Plymouth County with nearby schools including William L. Foster Elementary School, Hingham Middle School, and Hingham High School.
Ownership History
Date
Name
Owned For
Owner Type
Purchase Details
Closed on
Sep 13, 2022
Sold by
Sweeney Bryan P
Bought by
192 Otis Street Ret
Current Estimated Value
Purchase Details
Closed on
Mar 26, 2008
Sold by
Dreyer-Genest Suzanne
Bought by
Sweeney Bryan P
Home Financials for this Owner
Home Financials are based on the most recent Mortgage that was taken out on this home.
Original Mortgage
$85,000
Interest Rate
5.57%
Create a Home Valuation Report for This Property
The Home Valuation Report is an in-depth analysis detailing your home's value as well as a comparison with similar homes in the area
Home Values in the Area
Average Home Value in this Area
Purchase History
| Date | Buyer | Sale Price | Title Company |
|---|---|---|---|
| 192 Otis Street Ret | -- | None Available | |
| Sweeney Bryan P | $100,000 | -- |
Source: Public Records
Mortgage History
| Date | Status | Borrower | Loan Amount |
|---|---|---|---|
| Previous Owner | Sweeney Bryan P | $85,000 |
Source: Public Records
Tax History
| Year | Tax Paid | Tax Assessment Tax Assessment Total Assessment is a certain percentage of the fair market value that is determined by local assessors to be the total taxable value of land and additions on the property. | Land | Improvement |
|---|---|---|---|---|
| 2025 | $22,804 | $2,133,200 | $1,373,800 | $759,400 |
| 2024 | $22,414 | $2,065,800 | $1,373,800 | $692,000 |
| 2023 | $20,021 | $2,002,100 | $1,373,800 | $628,300 |
| 2022 | $19,023 | $1,645,600 | $1,144,800 | $500,800 |
| 2021 | $19,590 | $1,660,200 | $1,192,500 | $467,700 |
| 2020 | $19,142 | $1,660,200 | $1,192,500 | $467,700 |
| 2019 | $19,243 | $1,629,400 | $1,192,500 | $436,900 |
| 2018 | $19,178 | $1,629,400 | $1,192,500 | $436,900 |
| 2017 | $15,773 | $1,287,600 | $916,700 | $370,900 |
| 2016 | $15,539 | $1,244,100 | $873,200 | $370,900 |
| 2015 | $15,067 | $1,202,500 | $831,600 | $370,900 |
Source: Public Records
Map
Nearby Homes
- 67 Governor Long Rd
- 142 Otis St
- 12 Daley Rd
- 28 Marsh St
- 17 Paige St
- 37 Foley Beach Rd
- 59 Cottage St
- 2 Langlee Rd
- 16 Foley Beach Rd
- 43 Park View Dr
- 143 South St
- 190 South St Unit B
- 81 Kimball Beach Rd
- 191 South St
- 160 Hms Stayner Dr
- 160 Hms Stayner Dr Unit 160
- 93 Kimball Beach Rd
- 272 North St
- 151 Stayner Dr Unit 151
- 21 Hersey St
- 196 Otis St
- 11 Governor Long Rd
- 186 Otis St
- 200 Otis St
- 1 Governor Andrew Rd
- 199 Otis St
- 199 Otis St Unit 1
- 14 Governor Long Rd
- 3 Governor Andrew Rd
- 20 Governor Long Rd
- 47 Otis Hill Rd
- 48 Otis Hill Rd
- 6 Governor Long Rd
- 204 Otis St
- 178 Otis St
- 205 Otis St
- 7 Governor Andrew Rd
- 22 Governor Long Rd
- 22 Governor Long Rd Unit 1
- 22 Governor Long Rd Unit 22
Your Personal Tour Guide
Ask me questions while you tour the home.