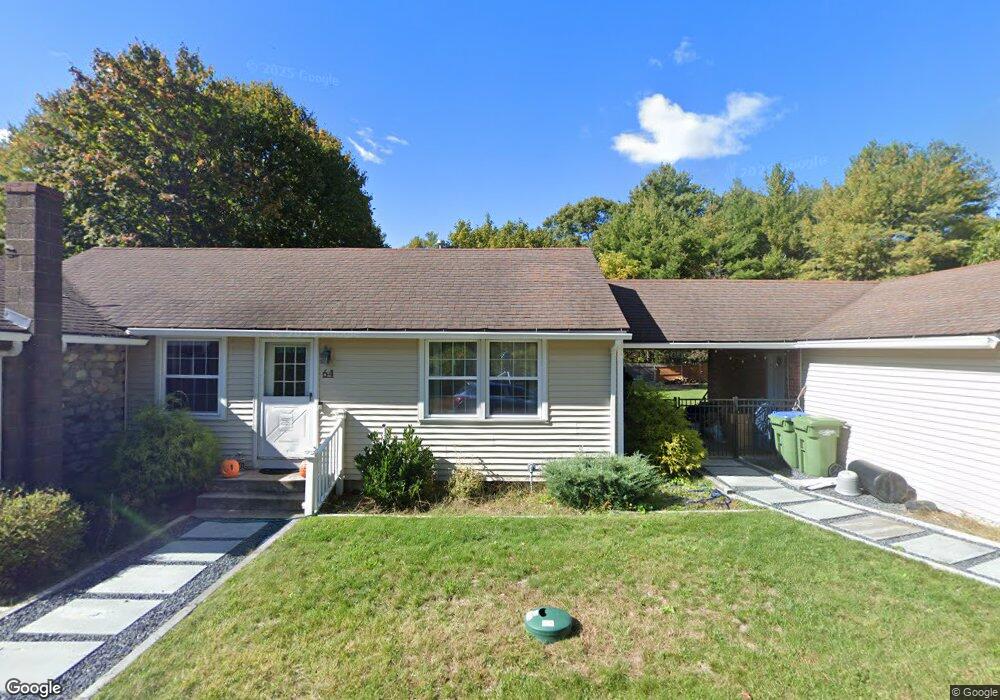
192 Plain St Rehoboth, MA 02769
Estimated Value: $567,894 - $744,000
2
Beds
2
Baths
1,474
Sq Ft
$442/Sq Ft
Est. Value
About This Home
This home is located at 192 Plain St, Rehoboth, MA 02769 and is currently estimated at $651,474, approximately $441 per square foot. 192 Plain St is a home located in Bristol County with nearby schools including Dighton-Rehoboth Regional High School.
Ownership History
Date
Name
Owned For
Owner Type
Purchase Details
Closed on
May 10, 2012
Sold by
Palmer River Dev Co Ll
Bought by
Breen Kevin T and Perry Sarah L
Current Estimated Value
Home Financials for this Owner
Home Financials are based on the most recent Mortgage that was taken out on this home.
Original Mortgage
$263,155
Outstanding Balance
$179,731
Interest Rate
3.75%
Mortgage Type
FHA
Estimated Equity
$471,743
Purchase Details
Closed on
Dec 30, 2011
Sold by
Reed Harriet A and Phillips Christopher U
Bought by
Palmer River Dev Co Ll
Home Financials for this Owner
Home Financials are based on the most recent Mortgage that was taken out on this home.
Original Mortgage
$40,000
Interest Rate
4%
Mortgage Type
Purchase Money Mortgage
Purchase Details
Closed on
May 4, 1993
Sold by
Phillips Christopher and Hillips Judi
Bought by
Phillips Helene R
Create a Home Valuation Report for This Property
The Home Valuation Report is an in-depth analysis detailing your home's value as well as a comparison with similar homes in the area
Home Values in the Area
Average Home Value in this Area
Purchase History
| Date | Buyer | Sale Price | Title Company |
|---|---|---|---|
| Breen Kevin T | $270,000 | -- | |
| Palmer River Dev Co Ll | $299,000 | -- | |
| Phillips Helene R | $45,000 | -- |
Source: Public Records
Mortgage History
| Date | Status | Borrower | Loan Amount |
|---|---|---|---|
| Open | Breen Kevin T | $263,155 | |
| Previous Owner | Palmer River Dev Co Ll | $40,000 |
Source: Public Records
Tax History
| Year | Tax Paid | Tax Assessment Tax Assessment Total Assessment is a certain percentage of the fair market value that is determined by local assessors to be the total taxable value of land and additions on the property. | Land | Improvement |
|---|---|---|---|---|
| 2025 | $4,360 | $391,000 | $172,800 | $218,200 |
| 2024 | $4,276 | $376,400 | $172,800 | $203,600 |
| 2023 | $4,168 | $359,900 | $169,200 | $190,700 |
| 2022 | $4,151 | $327,600 | $169,200 | $158,400 |
| 2021 | $2,960 | $303,600 | $161,400 | $142,200 |
| 2020 | $4,531 | $292,300 | $161,400 | $130,900 |
| 2018 | $4,093 | $281,200 | $153,600 | $127,600 |
| 2017 | $3,168 | $252,200 | $153,600 | $98,600 |
| 2016 | $3,103 | $255,400 | $153,600 | $101,800 |
| 2015 | $2,972 | $241,400 | $146,400 | $95,000 |
| 2014 | $2,872 | $230,900 | $139,200 | $91,700 |
Source: Public Records
Map
Nearby Homes
Your Personal Tour Guide
Ask me questions while you tour the home.