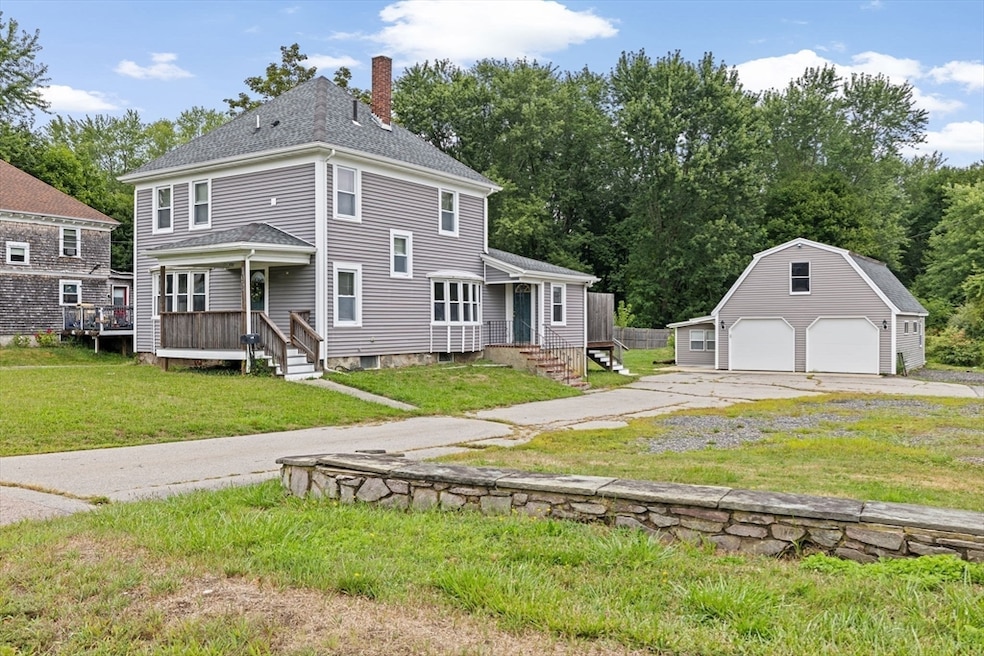
192 S Main St West Bridgewater, MA 02379
Estimated payment $3,762/month
Highlights
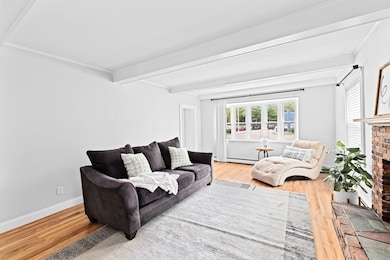
- Colonial Architecture
- Wooded Lot
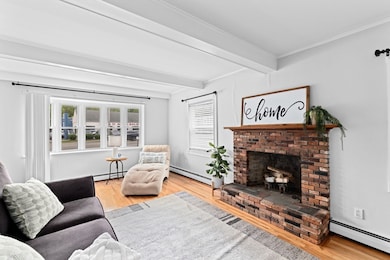
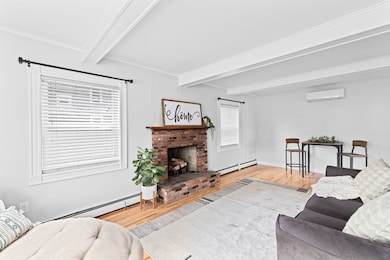
- 1 Fireplace
- Deck
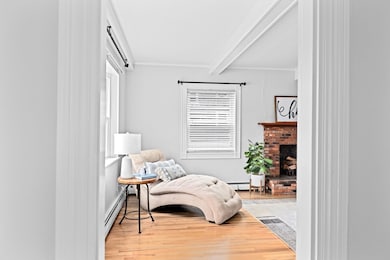
- Wood Flooring
- No HOA
About This Home
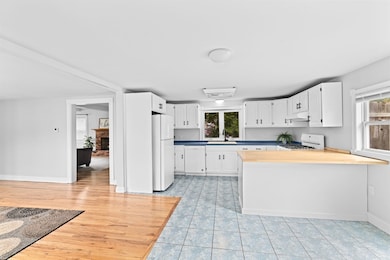
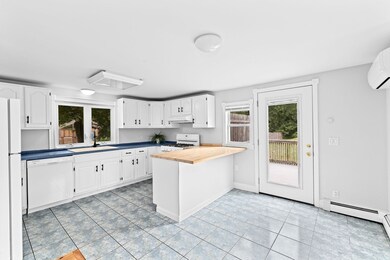
This one-of-a-kind, well-maintained property offers exceptional versatility and prime visibility! The main home features 3 bedrooms and 1.5 baths, with beautiful hardwood floors, a spacious family room, and an inviting dining area. Upstairs, you’ll find three generously sized bedrooms and a full bath with laundry. Adding to the appeal is a detached 2-car garage with a separate 1-bedroom, 1-bath living space, ideal for an in-law suite, home office, rental income, or business use (subject to local approvals). The garage space includes first-floor laundry hookups for added flexibility and separate utilities. With commercial zoning potential, this property opens the door to multiple opportunities while still offering the comfort of a residential home. Its high-traffic location and proximity to major routes, shopping, and area amenities make it a smart choice for investors, business owners, and anyone seeking a property with many options.
Home Details
Home Type
- Single Family
Est. Annual Taxes
- $7,439
Year Built
- Built in 1920
Lot Details
- 0.93 Acre Lot
- Wooded Lot
- Property is zoned Bus/Res/F
Parking
- 2 Car Detached Garage
- Parking Storage or Cabinetry
- Heated Garage
- Garage Door Opener
- Unpaved Parking
- Open Parking
- Off-Street Parking
Home Design
- Colonial Architecture
- Frame Construction
- Asphalt Roof
- Concrete Perimeter Foundation
Interior Spaces
- 1,526 Sq Ft Home
- 1 Fireplace
- Bay Window
- Insulated Doors
- Dishwasher
Flooring
- Wood
- Wall to Wall Carpet
- Ceramic Tile
Bedrooms and Bathrooms
- 3 Bedrooms
- Primary bedroom located on second floor
- Walk-In Closet
Laundry
- Laundry on upper level
- Washer and Electric Dryer Hookup
Unfinished Basement
- Basement Fills Entire Space Under The House
- Sump Pump
Outdoor Features
- Deck
- Porch
Additional Homes
- Accessory Dwelling Unit (ADU)
Schools
- Spring Elementary School
- Wb MSHS Middle School
- Wb MSHS High School
Utilities
- Ductless Heating Or Cooling System
- 5 Cooling Zones
- 2 Heating Zones
- Heating System Uses Natural Gas
- Baseboard Heating
- 200+ Amp Service
- Electric Water Heater
- Private Sewer
Community Details
- No Home Owners Association
Listing and Financial Details
- Assessor Parcel Number M:54 L:032,1197601
Map
Home Values in the Area
Average Home Value in this Area
Tax History
| Year | Tax Paid | Tax Assessment Tax Assessment Total Assessment is a certain percentage of the fair market value that is determined by local assessors to be the total taxable value of land and additions on the property. | Land | Improvement |
|---|---|---|---|---|
| 2025 | $7,439 | $544,200 | $287,900 | $256,300 |
| 2024 | $7,459 | $526,400 | $277,200 | $249,200 |
| 2023 | $6,933 | $451,100 | $245,200 | $205,900 |
| 2022 | $6,916 | $426,400 | $234,500 | $191,900 |
| 2021 | $6,873 | $411,300 | $234,500 | $176,800 |
| 2020 | $6,856 | $418,800 | $234,500 | $184,300 |
| 2019 | $6,824 | $412,800 | $234,500 | $178,300 |
| 2018 | $6,397 | $407,300 | $234,500 | $172,800 |
| 2017 | $6,746 | $380,500 | $213,200 | $167,300 |
| 2016 | $6,658 | $369,900 | $202,600 | $167,300 |
| 2015 | $6,296 | $353,500 | $191,900 | $161,600 |
| 2014 | $5,829 | $353,500 | $191,900 | $161,600 |
Property History
| Date | Event | Price | List to Sale | Price per Sq Ft |
|---|---|---|---|---|
| 11/17/2025 11/17/25 | For Sale | $599,000 | 0.0% | $393 / Sq Ft |
| 11/07/2025 11/07/25 | Pending | -- | -- | -- |
| 09/03/2025 09/03/25 | For Sale | $599,000 | -- | $393 / Sq Ft |
Purchase History
| Date | Type | Sale Price | Title Company |
|---|---|---|---|
| Deed | $177,210 | -- | |
| Foreclosure Deed | $234,000 | -- | |
| Deed | $370,000 | -- | |
| Deed | $139,000 | -- |
Mortgage History
| Date | Status | Loan Amount | Loan Type |
|---|---|---|---|
| Previous Owner | $351,500 | Purchase Money Mortgage | |
| Previous Owner | $100,000 | No Value Available | |
| Previous Owner | $150,000 | No Value Available | |
| Previous Owner | $75,000 | No Value Available |
Source: MLS Property Information Network (MLS PIN)
MLS Number: 73425291
APN: WBRI-000054-000000-000032
Disclaimer: Certain information contained herein is derived from information provided by parties other than Homes.com. All information provided is deemed reliable, but is not guaranteed to be accurate and should be independently verified.
![]() The property listing data and information, or the Images, set forth herein were provided to MLS Property Information Network, Inc. from third party sources, including sellers, lessors and public records, and were compiled by MLS Property Information Network, Inc. The property listing data and information, and the Images, are for the personal, non-commercial use of consumers having a good faith interest in purchasing or leasing listed properties of the type displayed to them and may not be used for any purpose other than to identify prospective properties which such consumers may have a good faith interest in purchasing or leasing. MLS Property Information Network, Inc. and its subscribers disclaim any and all representations and warranties as to the accuracy of the property listing data and information, or as to the accuracy of any of the Images, set forth herein.
The property listing data and information, or the Images, set forth herein were provided to MLS Property Information Network, Inc. from third party sources, including sellers, lessors and public records, and were compiled by MLS Property Information Network, Inc. The property listing data and information, and the Images, are for the personal, non-commercial use of consumers having a good faith interest in purchasing or leasing listed properties of the type displayed to them and may not be used for any purpose other than to identify prospective properties which such consumers may have a good faith interest in purchasing or leasing. MLS Property Information Network, Inc. and its subscribers disclaim any and all representations and warranties as to the accuracy of the property listing data and information, or as to the accuracy of any of the Images, set forth herein.
- 93 Aldrich Rd
- 464 Main St
- 464 Main St
- 50 Comfort St
- 28-30 Maolis Ave Unit 2
- 180 Main St
- 180 Main St Unit 4
- 180 Main St Unit 1305
- 368 N Elm St Unit 2
- 30 Church St
- 477 W Center St
- 37 Central Square Unit 37B
- 15 Maple Ave Unit 1
- 85 Bedford St
- 176 Plymouth St Unit 2
- 85 Plymouth St
- 262 Plymouth St Unit 1
- 51 Meadow Ln
- 90 Central St Unit 2
- 220 Bedford St Unit C-8
