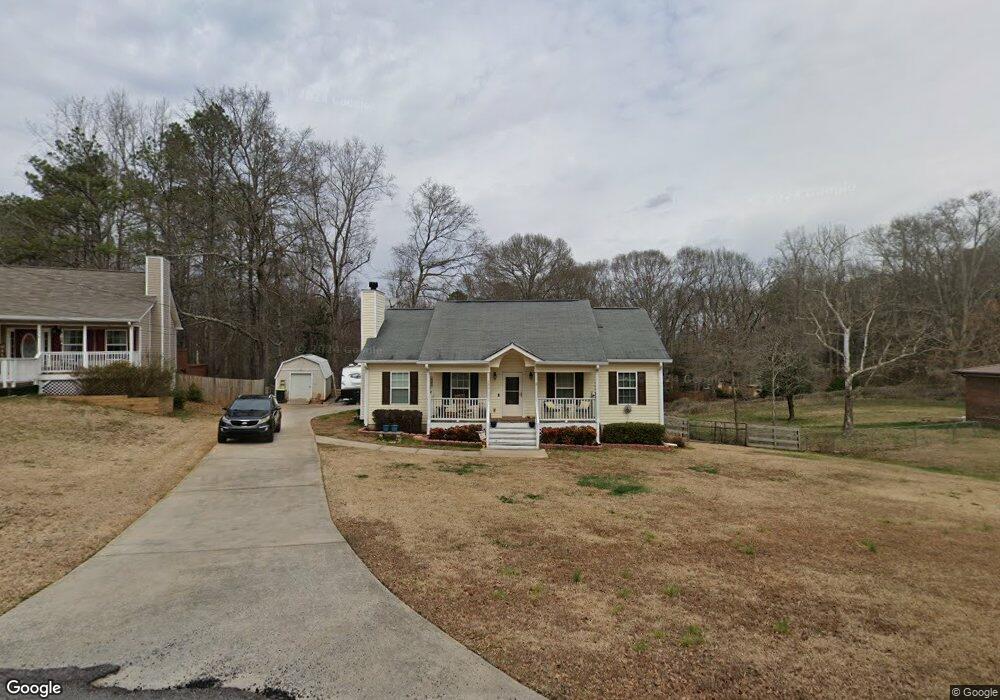
192 Tennessee Ave Temple, GA 30179
Estimated Value: $264,000 - $269,000
3
Beds
2
Baths
1,556
Sq Ft
$171/Sq Ft
Est. Value
About This Home
This home is located at 192 Tennessee Ave, Temple, GA 30179 and is currently estimated at $265,680, approximately $170 per square foot. 192 Tennessee Ave is a home located in Carroll County with nearby schools including Providence Elementary School, Temple Middle School, and Temple High School.
Ownership History
Date
Name
Owned For
Owner Type
Purchase Details
Closed on
Sep 28, 2018
Sold by
Keeter Rachel
Bought by
Roberds Nicki
Current Estimated Value
Home Financials for this Owner
Home Financials are based on the most recent Mortgage that was taken out on this home.
Original Mortgage
$138,446
Outstanding Balance
$120,952
Interest Rate
4.87%
Mortgage Type
FHA
Estimated Equity
$144,728
Purchase Details
Closed on
Jul 20, 2007
Sold by
Not Provided
Bought by
Keeter William and Keeter Rachel
Purchase Details
Closed on
Jul 6, 2005
Sold by
Grimes George Allen
Bought by
Destiny Ventures Inc
Purchase Details
Closed on
Jan 30, 1998
Sold by
Grimes George Allen
Bought by
Grimes George Allen
Purchase Details
Closed on
Jul 27, 1995
Sold by
Grimes Allen
Bought by
Grimes George Allen
Purchase Details
Closed on
Aug 11, 1989
Bought by
Grimes Allen
Create a Home Valuation Report for This Property
The Home Valuation Report is an in-depth analysis detailing your home's value as well as a comparison with similar homes in the area
Home Values in the Area
Average Home Value in this Area
Purchase History
| Date | Buyer | Sale Price | Title Company |
|---|---|---|---|
| Roberds Nicki | $141,000 | -- | |
| Keeter William | $112,400 | -- | |
| Destiny Ventures Inc | $20,000 | -- | |
| Grimes George Allen | -- | -- | |
| Grimes George Allen | -- | -- | |
| Grimes Allen | -- | -- |
Source: Public Records
Mortgage History
| Date | Status | Borrower | Loan Amount |
|---|---|---|---|
| Open | Roberds Nicki | $138,446 |
Source: Public Records
Tax History
| Year | Tax Paid | Tax Assessment Tax Assessment Total Assessment is a certain percentage of the fair market value that is determined by local assessors to be the total taxable value of land and additions on the property. | Land | Improvement |
|---|---|---|---|---|
| 2025 | $2,194 | $97,163 | $3,200 | $93,963 |
| 2024 | $2,214 | $97,163 | $3,200 | $93,963 |
| 2023 | $2,214 | $88,663 | $3,200 | $85,463 |
| 2022 | $1,909 | $71,760 | $3,200 | $68,560 |
| 2021 | $1,736 | $62,002 | $3,200 | $58,802 |
| 2020 | $1,594 | $55,615 | $3,200 | $52,415 |
| 2019 | $1,484 | $50,424 | $3,200 | $47,224 |
| 2018 | $447 | $41,189 | $3,200 | $37,989 |
| 2017 | $461 | $41,189 | $3,200 | $37,989 |
| 2016 | $464 | $41,189 | $3,200 | $37,989 |
| 2015 | $418 | $31,511 | $4,000 | $27,512 |
| 2014 | $421 | $31,512 | $4,000 | $27,512 |
Source: Public Records
Map
Nearby Homes
- 119 E Johnson St
- 44 E Johnson St
- 0 Highway 113 Unit 10586141
- 140 Creek Crossing Ln
- 110 Driver St
- 51 Carrollton St
- 292 E Johnson St
- 95 Carrollton St
- 130 Carroll St
- 116 Deer Crossing Unit LOT 4
- 96 Rome St
- 587 E Johnson St
- 121 E Woodland Manor
- 92 James St
- 407 Nottely Dr
- 221 Rome St
- 25 Old Bremen Rd
- 408 Nottely Dr
- 238 James Allen Place
- 502 Lanier Way
- 194 Tennessee Ave Unit 30179
- 85 Tennessee Ave
- 50 Riggs St
- 35 Riggs St
- 75 Tennessee Ave
- 25 Riggs St
- 3 Georgia Ave
- 63 Tennessee Ave
- 72 Tennessee Ave
- 40 Pineview Dr
- 527 Blackshear Way
- 53 Tennessee Ave
- 134 E Johnson St
- 124 E Johnson St
- 112 E Johnson St
- 160 E Johnson St Unit 1
- 160 E Johnson St
- 146 E Johnson St
- 14 Georgia Ave
- 172 E Johnson St
Your Personal Tour Guide
Ask me questions while you tour the home.