192 Trotters Way Torrington, CT 06790
Estimated Value: $353,000 - $376,000
3
Beds
3
Baths
1,748
Sq Ft
$206/Sq Ft
Est. Value
About This Home
This home is located at 192 Trotters Way, Torrington, CT 06790 and is currently estimated at $360,908, approximately $206 per square foot. 192 Trotters Way is a home located in Litchfield County with nearby schools including Torrington Middle School, Torrington High School, and Torrington Christian Academy.
Ownership History
Date
Name
Owned For
Owner Type
Purchase Details
Closed on
Apr 12, 2021
Sold by
Treung Moy and Khim Neam
Bought by
Treung Moy and Khim Neam
Current Estimated Value
Purchase Details
Closed on
Oct 24, 2011
Sold by
Daniels 2Nd John and Daniels Alison
Bought by
Treung Moy and Khim Neam
Home Financials for this Owner
Home Financials are based on the most recent Mortgage that was taken out on this home.
Original Mortgage
$96,960
Interest Rate
4.5%
Mortgage Type
FHA
Purchase Details
Closed on
Oct 1, 1999
Sold by
Yard Craig D and Yard Shari E
Bought by
Daniels John J and Mottola Alison
Home Financials for this Owner
Home Financials are based on the most recent Mortgage that was taken out on this home.
Original Mortgage
$111,200
Interest Rate
7.85%
Create a Home Valuation Report for This Property
The Home Valuation Report is an in-depth analysis detailing your home's value as well as a comparison with similar homes in the area
Home Values in the Area
Average Home Value in this Area
Purchase History
| Date | Buyer | Sale Price | Title Company |
|---|---|---|---|
| Treung Moy | -- | None Available | |
| Treung Moy | $165,000 | -- | |
| Daniels John J | $139,000 | -- |
Source: Public Records
Mortgage History
| Date | Status | Borrower | Loan Amount |
|---|---|---|---|
| Previous Owner | Daniels John J | $96,960 | |
| Previous Owner | Daniels John J | $127,000 | |
| Previous Owner | Daniels John J | $125,000 | |
| Previous Owner | Daniels John J | $111,200 | |
| Closed | Daniels John J | $13,900 |
Source: Public Records
Tax History Compared to Growth
Tax History
| Year | Tax Paid | Tax Assessment Tax Assessment Total Assessment is a certain percentage of the fair market value that is determined by local assessors to be the total taxable value of land and additions on the property. | Land | Improvement |
|---|---|---|---|---|
| 2025 | $7,900 | $205,450 | $30,240 | $175,210 |
| 2024 | $5,387 | $112,290 | $30,240 | $82,050 |
| 2023 | $5,385 | $112,290 | $30,240 | $82,050 |
| 2022 | $5,293 | $112,290 | $30,240 | $82,050 |
| 2021 | $5,184 | $112,290 | $30,240 | $82,050 |
| 2020 | $5,184 | $112,290 | $30,240 | $82,050 |
| 2019 | $4,982 | $107,900 | $20,160 | $87,740 |
| 2018 | $4,982 | $107,900 | $20,160 | $87,740 |
| 2017 | $4,936 | $107,900 | $20,160 | $87,740 |
| 2016 | $4,936 | $107,900 | $20,160 | $87,740 |
| 2015 | $4,936 | $107,900 | $20,160 | $87,740 |
| 2014 | $5,212 | $143,500 | $38,900 | $104,600 |
Source: Public Records
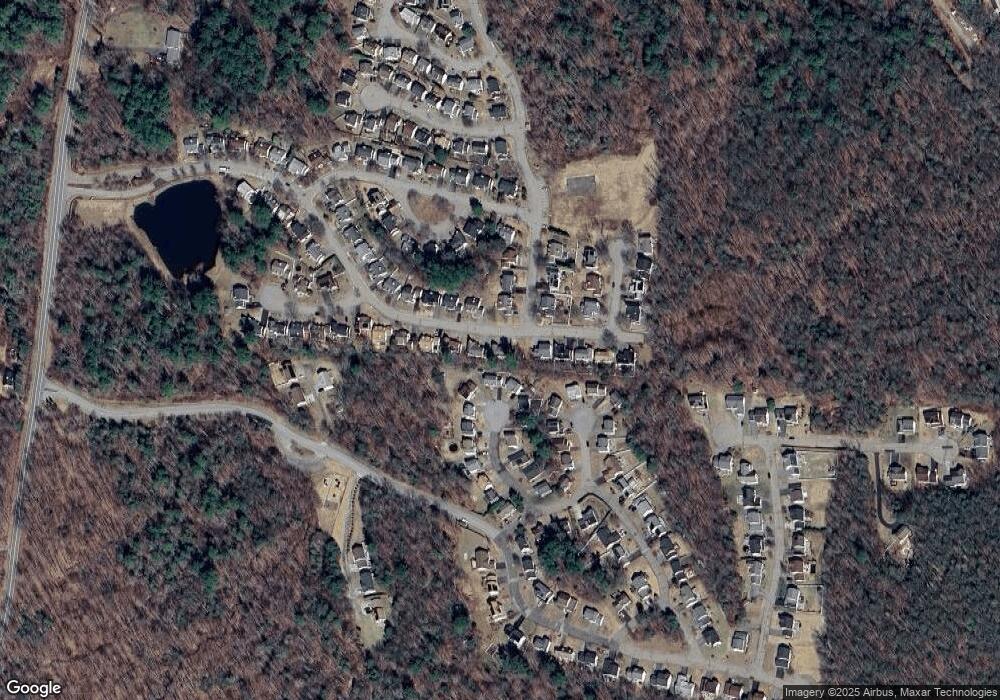
Map
Nearby Homes
- 30 Ascot Ln
- 229 White Oak Way
- 230 White Oak Way
- 3222 Torringford St
- 35 White Pine Rd
- 145 Oxford Way
- 353A Hayden Hill Rd
- 38 Auburn Way
- 260 Hayden Hill Rd
- 190 Hayden Hill Rd
- KENNEDY DRIVE & Torringford St
- 67 Wysteria Ct
- 2793 Torringford St W
- 2651 Torringford St W
- 2376 Torringford St
- 300 W Hill Rd
- 408 A Niles Rd
- 302 Gillette Rd
- 70 Suncrest Ct
- 290 Gillette Rd
- 182 Trotters Way
- 118 Winterberry Way
- 116 Winterberry Way
- 210 Trotters Way
- 7 Ascot Ln
- 172 Trotters Way
- 117 Winterberry Way
- 114 Winterberry Way
- 179 Trotters Way
- 216 Trotters Way
- 115 Winterberry Way
- 10 Ascot Ln
- 17 Ascot Ln
- 112 Winterberry Way
- 233 White Oak Way
- 164 Trotters Way
- 235 White Oak Way
- 111 Winterberry Way
- 226 Trotters Way
- 163 Trotters Way