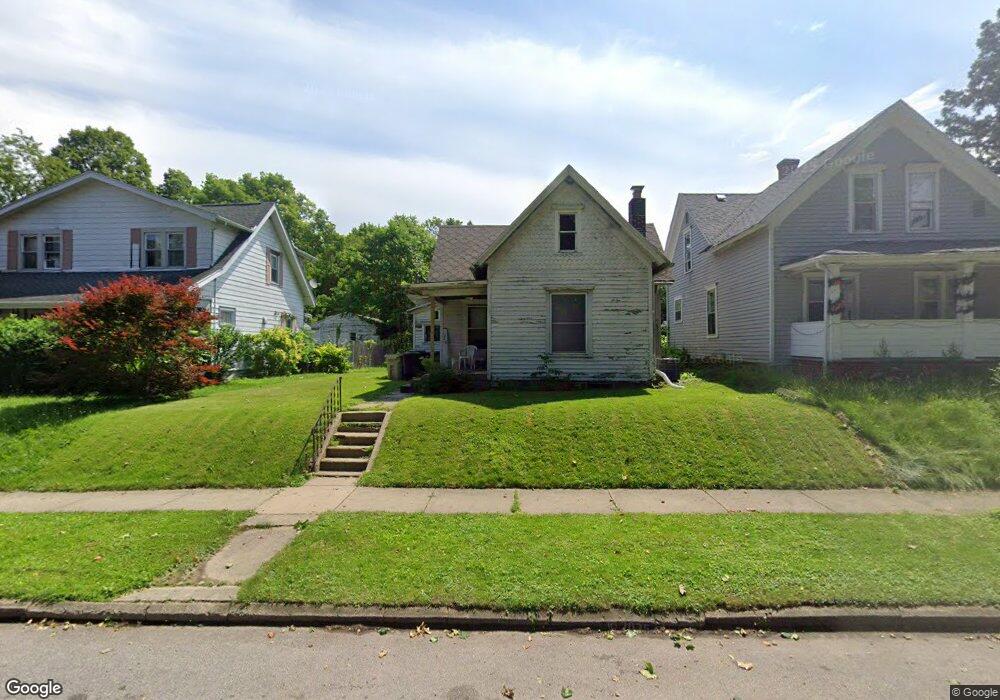
1920 Catalpa Ave South Bend, IN 46613
Rum Village NeighborhoodEstimated Value: $85,000 - $134,000
2
Beds
1
Bath
1,057
Sq Ft
$103/Sq Ft
Est. Value
About This Home
This home is located at 1920 Catalpa Ave, South Bend, IN 46613 and is currently estimated at $109,195, approximately $103 per square foot. 1920 Catalpa Ave is a home located in St. Joseph County with nearby schools including Marshall Traditional School, Clay Intermediate Center, and Monroe Elementary School.
Ownership History
Date
Name
Owned For
Owner Type
Purchase Details
Closed on
Jun 19, 2008
Sold by
Mass Management Inc
Bought by
Smith Kay and Smith Eric L
Current Estimated Value
Purchase Details
Closed on
Apr 2, 2008
Sold by
Deutche Bank Natioal Trust Co
Bought by
Destiny Ventures Llc
Purchase Details
Closed on
Jul 26, 2007
Sold by
Sherk John and Sherk Lori
Bought by
Dutsche Bank National Trust Co
Purchase Details
Closed on
Apr 27, 2006
Sold by
Haste Aron
Bought by
Sherk John and Sherk Lori
Home Financials for this Owner
Home Financials are based on the most recent Mortgage that was taken out on this home.
Original Mortgage
$54,000
Interest Rate
9.3%
Mortgage Type
Adjustable Rate Mortgage/ARM
Purchase Details
Closed on
Feb 2, 2006
Sold by
Reiter Janet L and Geehring Karen A
Bought by
Haste Aaron M
Create a Home Valuation Report for This Property
The Home Valuation Report is an in-depth analysis detailing your home's value as well as a comparison with similar homes in the area
Home Values in the Area
Average Home Value in this Area
Purchase History
| Date | Buyer | Sale Price | Title Company |
|---|---|---|---|
| Smith Kay | -- | None Available | |
| Destiny Ventures Llc | -- | Hold For Meridian Title Crop | |
| Dutsche Bank National Trust Co | $27,000 | None Available | |
| Sherk John | -- | Landamerica Lawyers Title | |
| Haste Aaron M | -- | Land America Lawyers Title |
Source: Public Records
Mortgage History
| Date | Status | Borrower | Loan Amount |
|---|---|---|---|
| Previous Owner | Sherk John | $54,000 |
Source: Public Records
Tax History Compared to Growth
Tax History
| Year | Tax Paid | Tax Assessment Tax Assessment Total Assessment is a certain percentage of the fair market value that is determined by local assessors to be the total taxable value of land and additions on the property. | Land | Improvement |
|---|---|---|---|---|
| 2024 | $1,001 | $66,700 | $6,600 | $60,100 |
| 2023 | $965 | $39,700 | $6,600 | $33,100 |
| 2022 | $965 | $39,700 | $6,600 | $33,100 |
| 2021 | $833 | $32,500 | $2,300 | $30,200 |
| 2020 | $833 | $32,500 | $2,300 | $30,200 |
| 2019 | $551 | $25,000 | $2,500 | $22,500 |
| 2018 | $648 | $25,000 | $2,500 | $22,500 |
| 2017 | $667 | $24,800 | $2,500 | $22,300 |
| 2016 | $681 | $24,800 | $2,500 | $22,300 |
| 2014 | $647 | $24,500 | $2,500 | $22,000 |
Source: Public Records
Map
Nearby Homes
- 2009 Catalpa St
- 914 W Calvert St
- 726 W Calvert St
- 2213 Kendall St
- PRAIRIE AVE. (Sr 23 ) and Indiana Ave
- 1819 S Scott St
- 1723 Kendall St
- 1722 Kendall St
- 2126 S Taylor St
- 1637 Kemble Ave
- 1631 S Scott St
- 2022 Swygart Ave
- 610 W Indiana Ave
- 1202 W Indiana Ave
- 1317 W Indiana Ave
- 1413 W Indiana Ave
- 1722 Nash St
- 1601 Magnolia St
- 122 E Indiana Ave
- 136 E Victoria St
- 1914 Catalpa Ave
- 1922 Catalpa Ave
- 1922 Catalpa St
- 1910 Catalpa Ave
- 2002 Catalpa Ave
- 1919 Chapin St
- 1923 Chapin St
- 1915 Chapin St
- 1908 Catalpa Ave
- 2008 Catalpa Ave
- 1909 Chapin St
- 2001 Chapin St
- 1921 Catalpa Ave
- 1915 Catalpa St
- 1905 Chapin St
- 1902 Catalpa Ave
- 1921 Catalpa St
- 1917 Catalpa Ave
- 2005 Chapin St
- 2010 Catalpa Ave