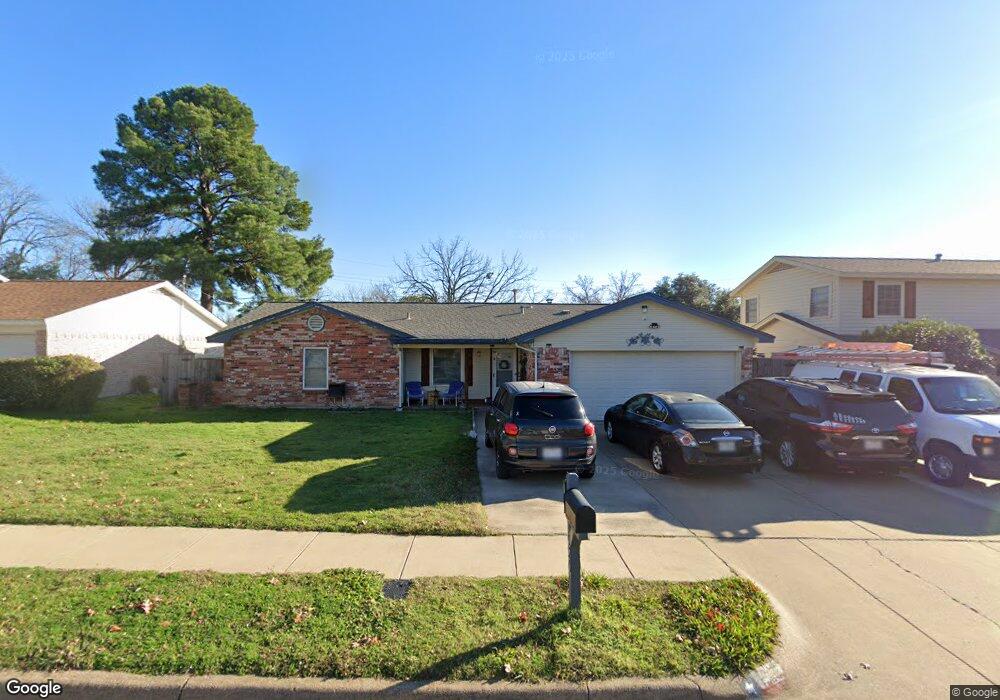
1920 Chattanooga Dr Bedford, TX 76022
Estimated Value: $400,000
4
Beds
2
Baths
2,039
Sq Ft
$196/Sq Ft
Est. Value
About This Home
This home is located at 1920 Chattanooga Dr, Bedford, TX 76022 and is currently estimated at $400,000, approximately $196 per square foot. 1920 Chattanooga Dr is a home located in Tarrant County with nearby schools including Bell Manor Elementary School, Central J High School, and Trinity High School.
Ownership History
Date
Name
Owned For
Owner Type
Purchase Details
Closed on
Dec 23, 2020
Sold by
Thompson Tommy
Bought by
Jazmati Ammar
Current Estimated Value
Home Financials for this Owner
Home Financials are based on the most recent Mortgage that was taken out on this home.
Original Mortgage
$212,000
Outstanding Balance
$189,080
Interest Rate
2.8%
Mortgage Type
New Conventional
Estimated Equity
$210,920
Purchase Details
Closed on
Dec 31, 1998
Sold by
Va
Bought by
Thompson Tommy
Home Financials for this Owner
Home Financials are based on the most recent Mortgage that was taken out on this home.
Original Mortgage
$82,552
Interest Rate
6.74%
Mortgage Type
FHA
Purchase Details
Closed on
Jul 7, 1998
Sold by
Union Fsb Of Indianapolis
Bought by
Va
Create a Home Valuation Report for This Property
The Home Valuation Report is an in-depth analysis detailing your home's value as well as a comparison with similar homes in the area
Home Values in the Area
Average Home Value in this Area
Purchase History
| Date | Buyer | Sale Price | Title Company |
|---|---|---|---|
| Jazmati Ammar | -- | Spark Title Llc | |
| Thompson Tommy | -- | Safeco Land Title | |
| Thompson Tommy | $448 | Safeco Land Title | |
| Va | -- | -- | |
| Union Fsb Of Indianapolis | $76,567 | -- |
Source: Public Records
Mortgage History
| Date | Status | Borrower | Loan Amount |
|---|---|---|---|
| Open | Jazmati Ammar | $212,000 | |
| Previous Owner | Thompson Tommy | $82,552 |
Source: Public Records
Tax History Compared to Growth
Tax History
| Year | Tax Paid | Tax Assessment Tax Assessment Total Assessment is a certain percentage of the fair market value that is determined by local assessors to be the total taxable value of land and additions on the property. | Land | Improvement |
|---|---|---|---|---|
| 2025 | $5,598 | $353,528 | $65,000 | $288,528 |
| 2024 | $5,598 | $353,528 | $65,000 | $288,528 |
| 2023 | $6,175 | $333,641 | $45,000 | $288,641 |
| 2022 | $6,392 | $315,493 | $45,000 | $270,493 |
| 2021 | $6,268 | $266,071 | $45,000 | $221,071 |
| 2020 | $5,020 | $236,924 | $45,000 | $191,924 |
| 2019 | $4,663 | $238,701 | $45,000 | $193,701 |
| 2018 | $3,857 | $174,494 | $23,000 | $151,494 |
| 2017 | $3,838 | $182,322 | $23,000 | $159,322 |
| 2016 | $3,489 | $165,081 | $23,000 | $142,081 |
| 2015 | $3,017 | $131,100 | $18,000 | $113,100 |
| 2014 | $3,017 | $131,100 | $18,000 | $113,100 |
Source: Public Records
Map
Nearby Homes
- 952 Charleston Dr
- 2024 Charleston Dr
- 2101 Gettysburg Place
- 933 Charleston Ct
- 804 Natchez Ave
- 1613 Trinity Ct
- 828 Gregory Ave
- 2201 Greendale Ct
- 808 Gregory Ave
- 1604 Richmond Dr
- 2025 Schumac Ln
- 1049 Stableway Ln
- 1213 Greendale Dr
- 1701 Winchester Way
- 800 Prestwick St
- 1116 Highpoint Rd
- 2420 Dalewood Ln
- 2421 Creek Villas Dr
- 2428 Chestnut Way
- 1216 Princeton Place
- 1924 Chattanooga Dr
- 1916 Chattanooga Dr
- 1921 Charleston Dr
- 1917 Charleston Dr
- 1912 Chattanooga Dr
- 1928 Chattanooga Dr
- 1925 Charleston Dr
- 1921 Chattanooga Dr
- 1925 Chattanooga Dr
- 1917 Chattanooga Dr
- 1913 Charleston Dr
- 2001 Charleston Dr
- 2000 Chattanooga Dr
- 1929 Chattanooga Dr
- 1908 Chattanooga Dr
- 1913 Chattanooga Dr
- 1909 Charleston Dr
- 1933 Chattanooga Dr
- 2005 Charleston Dr
- 1909 Chattanooga Dr