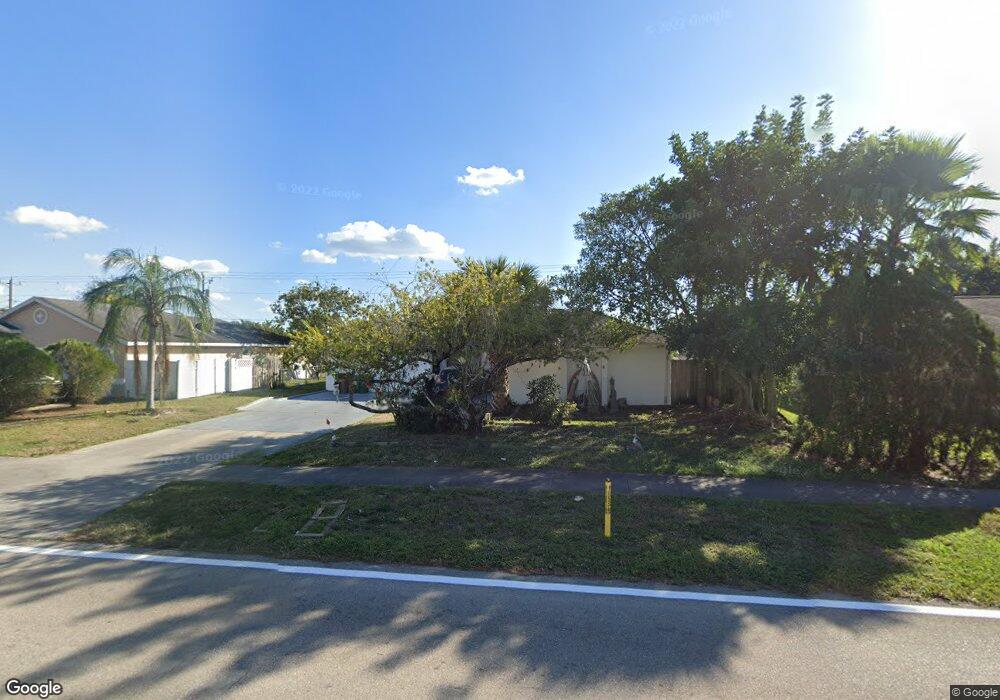
1920 Hancock Bridge Pkwy Cape Coral, FL 33990
Hancock NeighborhoodEstimated Value: $334,000 - $479,000
3
Beds
3
Baths
2,627
Sq Ft
$144/Sq Ft
Est. Value
About This Home
This home is located at 1920 Hancock Bridge Pkwy, Cape Coral, FL 33990 and is currently estimated at $378,549, approximately $144 per square foot. 1920 Hancock Bridge Pkwy is a home located in Lee County with nearby schools including Caloosa Elementary School, Tropic Isles Elementary School, and Hancock Creek Elementary School.
Ownership History
Date
Name
Owned For
Owner Type
Purchase Details
Closed on
Dec 11, 2013
Sold by
Fannie Mae
Bought by
Murania Sonja
Current Estimated Value
Purchase Details
Closed on
Jun 11, 2013
Sold by
Harney William R
Bought by
Federal National Mortgage Association
Purchase Details
Closed on
Nov 10, 2003
Sold by
Fruth Marian A and Fruth Richard D
Bought by
Harney William R and Harney Loretta A
Home Financials for this Owner
Home Financials are based on the most recent Mortgage that was taken out on this home.
Original Mortgage
$160,400
Interest Rate
5.93%
Purchase Details
Closed on
Jun 9, 1998
Sold by
Carbonell Phyllis A and Bowman Phyllis A
Bought by
Fruth Marian A
Create a Home Valuation Report for This Property
The Home Valuation Report is an in-depth analysis detailing your home's value as well as a comparison with similar homes in the area
Home Values in the Area
Average Home Value in this Area
Purchase History
| Date | Buyer | Sale Price | Title Company |
|---|---|---|---|
| Murania Sonja | $127,000 | Title & Abstract Agency Of A | |
| Federal National Mortgage Association | -- | None Available | |
| Harney William R | $168,900 | -- | |
| Fruth Marian A | $90,000 | -- |
Source: Public Records
Mortgage History
| Date | Status | Borrower | Loan Amount |
|---|---|---|---|
| Previous Owner | Harney William R | $160,400 |
Source: Public Records
Tax History Compared to Growth
Tax History
| Year | Tax Paid | Tax Assessment Tax Assessment Total Assessment is a certain percentage of the fair market value that is determined by local assessors to be the total taxable value of land and additions on the property. | Land | Improvement |
|---|---|---|---|---|
| 2025 | $5,096 | $271,266 | -- | -- |
| 2024 | $4,783 | $246,605 | -- | -- |
| 2023 | $4,783 | $224,186 | $0 | $0 |
| 2022 | $4,207 | $203,805 | $0 | $0 |
| 2021 | $3,801 | $185,277 | $24,959 | $160,318 |
| 2020 | $3,617 | $168,771 | $24,000 | $144,771 |
| 2019 | $3,560 | $167,147 | $24,000 | $143,147 |
| 2018 | $3,458 | $158,260 | $24,000 | $134,260 |
| 2017 | $3,460 | $158,272 | $22,000 | $136,272 |
| 2016 | $3,165 | $139,994 | $22,686 | $117,308 |
| 2015 | $2,964 | $127,503 | $13,629 | $113,874 |
| 2014 | $2,827 | $119,917 | $9,650 | $110,267 |
| 2013 | -- | $103,494 | $7,553 | $95,941 |
Source: Public Records
Map
Nearby Homes
- 1843 Hancock Bridge Pkwy Unit 30
- 1831 SE van Loon Terrace
- 1813 Hancock Bridge Pkwy
- 207 SE 20th Place
- 105 NE 20th Ct
- 109 NE 20th Ct
- 2818 NE NE 1st St
- 1802 NE van Loon Terrace
- 2007 NE 20th Ct
- 118 NE 21st Ave
- 2105 SE 2nd Terrace
- 1930 NE 2nd Terrace
- 236 SE 20th Ct
- 1726 SE 2nd St
- 4105 NE 21st Ave
- 503 NE 21st Ave
- 3607 NE 21st Ave
- 1725 SE 3rd St
- 2220 SE 2nd Terrace
- 113 NE 16th Place
- 1924 Hancock Bridge Pkwy
- 1916 Hancock Bridge Pkwy
- 1919 SE van Loon Terrace Unit 18
- 1923 SE van Loon Terrace
- 1928 Hancock Bridge Pkwy
- 1915 SE van Loon Terrace
- 1912 Hancock Bridge Pkwy
- 1927 SE van Loon Terrace
- 1919 Hancock Bridge Pkwy Unit 36-37
- 1919 Hancock Bridge Pkwy
- 1932 Hancock Bridge Pkwy
- 1909 SE van Loon Terrace
- 1923 Hancock Bridge Pkwy
- 1915 Hancock Bridge Pkwy
- 1931 SE van Loon Terrace
- 1906 Hancock Bridge Pkwy
- 1929 Hancock Bridge Pkwy
- 1920 SE van Loon Terrace
- 1911 Hancock Bridge Pkwy
- 1924 SE van Loon Terrace