Estimated Value: $139,000 - $158,000
3
Beds
1
Bath
1,369
Sq Ft
$110/Sq Ft
Est. Value
About This Home
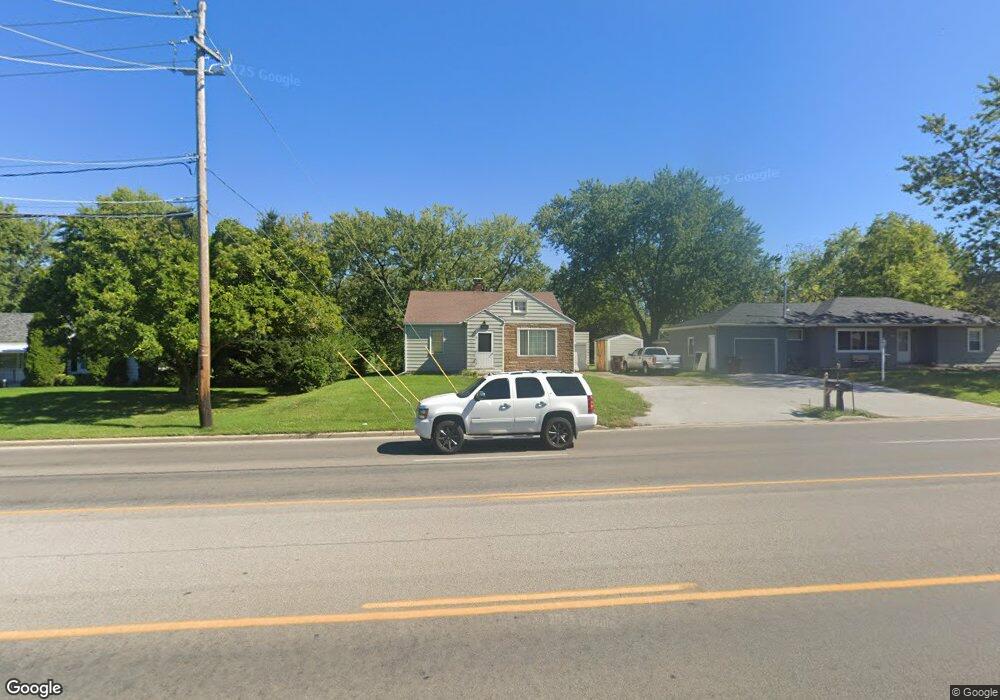
This home is located at 1920 N Eastown Rd, Lima, OH 45807 and is currently estimated at $149,936, approximately $109 per square foot. 1920 N Eastown Rd is a home located in Allen County with nearby schools including Elida Elementary School, Elida Middle School, and Elida High School.
Ownership History
Date
Name
Owned For
Owner Type
Purchase Details
Closed on
May 23, 2014
Sold by
Bruns Wendy and Parkhill Wendy L
Bought by
Parkhill Matthew Charles
Current Estimated Value
Purchase Details
Closed on
Dec 16, 2002
Sold by
Layman Timothy W
Bought by
Bruns Matthew C Parkhill Wendy
Home Financials for this Owner
Home Financials are based on the most recent Mortgage that was taken out on this home.
Original Mortgage
$57,596
Outstanding Balance
$24,758
Interest Rate
6.25%
Mortgage Type
FHA
Estimated Equity
$125,178
Purchase Details
Closed on
Jun 13, 1996
Sold by
Bauman Stanley
Bought by
Layman Timothy
Home Financials for this Owner
Home Financials are based on the most recent Mortgage that was taken out on this home.
Original Mortgage
$38,000
Interest Rate
8.05%
Mortgage Type
New Conventional
Purchase Details
Closed on
Nov 1, 1981
Bought by
Bauman Stanley
Create a Home Valuation Report for This Property
The Home Valuation Report is an in-depth analysis detailing your home's value as well as a comparison with similar homes in the area
Home Values in the Area
Average Home Value in this Area
Purchase History
| Date | Buyer | Sale Price | Title Company |
|---|---|---|---|
| Parkhill Matthew Charles | -- | None Available | |
| Bruns Matthew C Parkhill Wendy | $57,596 | -- | |
| Layman Timothy | $40,000 | -- | |
| Bauman Stanley | $36,000 | -- |
Source: Public Records
Mortgage History
| Date | Status | Borrower | Loan Amount |
|---|---|---|---|
| Open | Bruns Matthew C Parkhill Wendy | $57,596 | |
| Previous Owner | Layman Timothy | $38,000 |
Source: Public Records
Tax History Compared to Growth
Tax History
| Year | Tax Paid | Tax Assessment Tax Assessment Total Assessment is a certain percentage of the fair market value that is determined by local assessors to be the total taxable value of land and additions on the property. | Land | Improvement |
|---|---|---|---|---|
| 2024 | $1,505 | $34,480 | $8,020 | $26,460 |
| 2023 | $1,231 | $24,990 | $5,810 | $19,180 |
| 2022 | $1,256 | $24,990 | $5,810 | $19,180 |
| 2021 | $1,260 | $24,990 | $5,810 | $19,180 |
| 2020 | $1,120 | $20,660 | $5,290 | $15,370 |
| 2019 | $1,120 | $20,660 | $5,290 | $15,370 |
| 2018 | $1,307 | $20,660 | $5,290 | $15,370 |
| 2017 | $1,239 | $18,660 | $5,290 | $13,370 |
| 2016 | $1,235 | $18,660 | $5,290 | $13,370 |
| 2015 | $1,241 | $18,660 | $5,290 | $13,370 |
| 2014 | $1,719 | $18,520 | $5,500 | $13,020 |
| 2013 | $1,162 | $18,520 | $5,500 | $13,020 |
Source: Public Records
Map
Nearby Homes
- 8 Bridle Trail
- 174 Bridle Trail
- 14 Deer Run
- 224 Buckingham Dr
- 3790 Comanche Dr
- 3660 Comanche Dr
- 3624 Comanche Dr
- 3619 Comanche Dr
- 3637 Comanche Dr
- 3687 Comanche
- 3705 Comanche
- 4010 Neely Rd
- 1392 Chancellor Dr
- 37 Beaumont Place
- 00 Allentown Rd
- 0 Allentown Rd
- 2275 N Cable Rd Unit 43 Unit Package
- 2275 N Cable Rd Unit 70
- 2275 N Cable Rd Unit 25
- 2275 N Cable Rd
- 1910 N Eastown Rd
- 1940 N Eastown Rd
- N N Eastown Rd
- 0 N Eastown Rd
- 1921 N Eastown Rd
- 1960 N Eastown Rd
- 1911 N Eastown Rd
- 1939 N Eastown Rd
- 1889 N Eastown Rd
- 1959 N Eastown Rd
- 1976 N Eastown Rd
- 1875 N Eastown Rd
- 1967 N Eastown Rd
- 3 Bridle Trail
- 2 Bridle Trail
- 1990 N Eastown Rd
- 7 Bridle Trail
- 1859 N Eastown Rd
- 7 Bridle Trail