Estimated Value: $218,000 - $332,000
3
Beds
2
Baths
1,404
Sq Ft
$177/Sq Ft
Est. Value
About This Home
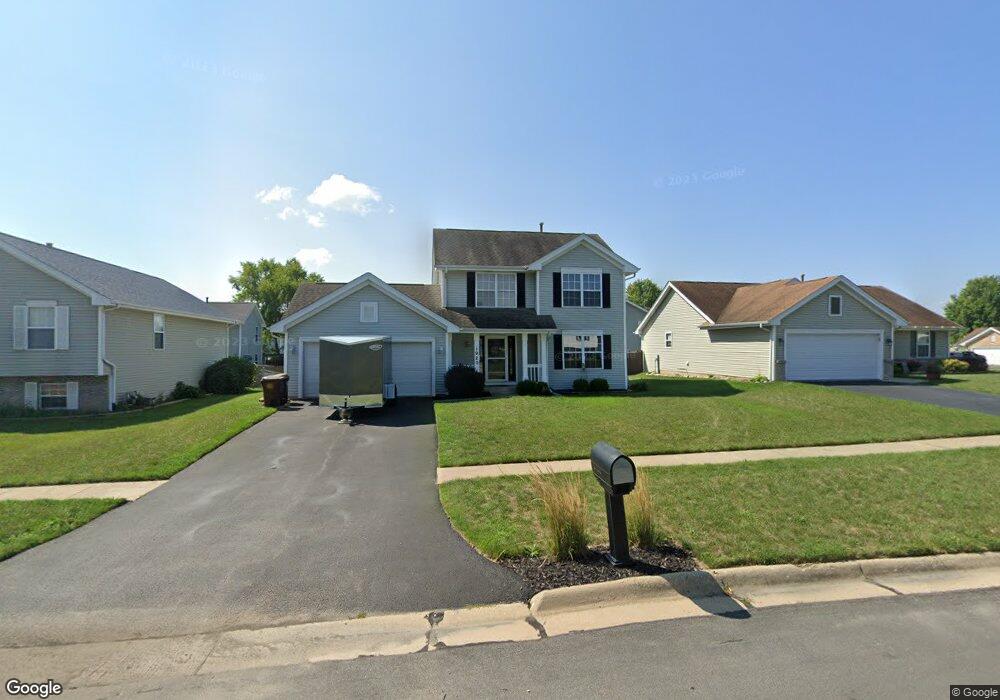
This home is located at 1920 Silverthorn Dr, Byron, IL 61010 and is currently estimated at $249,198, approximately $177 per square foot. 1920 Silverthorn Dr is a home located in Ogle County with nearby schools including Mary Morgan Elementary School, Byron Middle School, and Byron High School.
Ownership History
Date
Name
Owned For
Owner Type
Purchase Details
Closed on
Sep 5, 2017
Sold by
Jackson Travis and Jackson Kristina G
Bought by
Klotz Kyle J
Current Estimated Value
Purchase Details
Closed on
Jan 13, 2010
Sold by
Secretary Of Housing & Urban Development
Bought by
Jackson Travis
Home Financials for this Owner
Home Financials are based on the most recent Mortgage that was taken out on this home.
Original Mortgage
$74,000
Interest Rate
5.01%
Mortgage Type
New Conventional
Purchase Details
Closed on
Jun 5, 2009
Sold by
Eberhart Micah and Banta Joyce
Bought by
The Secretary Of Housing & Urban Develop
Purchase Details
Closed on
May 11, 2007
Sold by
Lindgren Sven O and Lindgren Berit L
Bought by
Eberhart Micah and Banta Joyce
Home Financials for this Owner
Home Financials are based on the most recent Mortgage that was taken out on this home.
Original Mortgage
$140,298
Interest Rate
6.21%
Mortgage Type
FHA
Create a Home Valuation Report for This Property
The Home Valuation Report is an in-depth analysis detailing your home's value as well as a comparison with similar homes in the area
Home Values in the Area
Average Home Value in this Area
Purchase History
| Date | Buyer | Sale Price | Title Company |
|---|---|---|---|
| Klotz Kyle J | $135,000 | -- | |
| Jackson Travis | $92,500 | Stewart Title Company | |
| The Secretary Of Housing & Urban Develop | $155,856 | None Available | |
| Eberhart Micah | $143,000 | None Available |
Source: Public Records
Mortgage History
| Date | Status | Borrower | Loan Amount |
|---|---|---|---|
| Previous Owner | Jackson Travis | $74,000 | |
| Previous Owner | Eberhart Micah | $140,298 |
Source: Public Records
Tax History
| Year | Tax Paid | Tax Assessment Tax Assessment Total Assessment is a certain percentage of the fair market value that is determined by local assessors to be the total taxable value of land and additions on the property. | Land | Improvement |
|---|---|---|---|---|
| 2024 | $4,308 | $56,370 | $8,114 | $48,256 |
| 2023 | $4,012 | $53,589 | $7,714 | $45,875 |
| 2022 | $3,747 | $49,698 | $7,154 | $42,544 |
| 2021 | $3,672 | $47,577 | $6,849 | $40,728 |
| 2020 | $3,377 | $46,644 | $6,715 | $39,929 |
| 2019 | $3,372 | $45,176 | $6,504 | $38,672 |
| 2018 | $3,360 | $44,010 | $6,336 | $37,674 |
| 2017 | $3,164 | $42,168 | $6,336 | $35,832 |
| 2016 | $2,966 | $41,394 | $6,220 | $35,174 |
| 2015 | $2,809 | $40,071 | $6,021 | $34,050 |
| 2014 | $2,779 | $40,071 | $6,021 | $34,050 |
| 2013 | $2,880 | $40,586 | $6,098 | $34,488 |
Source: Public Records
Map
Nearby Homes
- 1903 Silverthorn Dr
- 1538 Southfield Ln
- 1245 Glacier Dr
- 1257 Glacier Dr
- 1368 Joanne Terrace
- 8668 Yosemite Dr
- 2917 Everett Ln
- 265 Creekside Dr
- 1574 Warrenton Dr
- 151 N Fox Run Ln
- 932 W 2nd St
- 8890 Hales Corner Rd Rd
- 820 Crest View Trail
- 509 N Walnut St
- 713 Birch St
- 00 E Ashelford Dr Unit LOT 8
- 00 E Ashelford Dr
- 617 E 3rd St
- 8894 Illinois 2
- 6315 N River Rd
- 1924 Silverthorn Dr
- 850 Seven Hickory Rd
- 849 Brookview Dr
- 1902 Silverthorn Dr
- 838 Seven Hickory Rd
- 838 7 Hickory Rd
- 837 Brookview Dr
- 1921 Silverthorn Dr
- 1925 Silverthorn Dr
- 2002 Silverthorn Dr
- 826 Seven Hickory Rd
- 825 Brookview Dr
- 1929 Silverthorn Dr
- 2001 Silverthorn Dr
- 901 Seven Hickory Rd
- 853 Seven Hickory Rd
- 865 Seven Hickory Rd
- 849 Seven Hickory Rd
- 850 Brookview Dr
- 000 N Hedge Rd
Your Personal Tour Guide
Ask me questions while you tour the home.