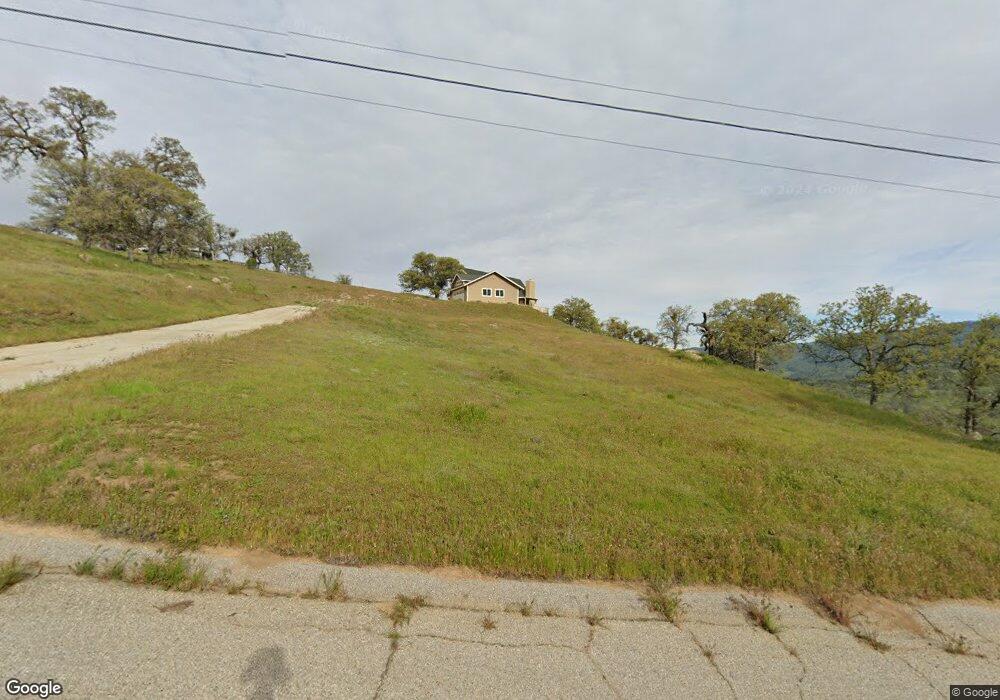
19201 Mustang Dr Tehachapi, CA 93561
Estimated Value: $432,581 - $536,000
3
Beds
2
Baths
1,305
Sq Ft
$366/Sq Ft
Est. Value
About This Home
This home is located at 19201 Mustang Dr, Tehachapi, CA 93561 and is currently estimated at $477,395, approximately $365 per square foot. 19201 Mustang Dr is a home located in Kern County with nearby schools including Cummings Valley Elementary School, Jacobsen Middle School, and Tehachapi High School.
Ownership History
Date
Name
Owned For
Owner Type
Purchase Details
Closed on
Jun 18, 2015
Sold by
Langley Raymond J and Langley Terri A
Bought by
The Raymond & Terri Langley 2015 Trust
Current Estimated Value
Purchase Details
Closed on
Jun 27, 2000
Sold by
Va
Bought by
Langley Raymond J and Langley Terri A
Home Financials for this Owner
Home Financials are based on the most recent Mortgage that was taken out on this home.
Original Mortgage
$102,000
Interest Rate
8.37%
Purchase Details
Closed on
Oct 25, 1999
Sold by
Norwest Mtg Inc
Bought by
Va
Purchase Details
Closed on
Sep 23, 1999
Sold by
Baker Roger L
Bought by
Norwest Mtg Inc
Purchase Details
Closed on
Jul 10, 1997
Sold by
Baker Patricia
Bought by
Baker Roger L
Purchase Details
Closed on
Apr 28, 1997
Sold by
Spreckman and Ann
Bought by
Baker Roger L
Home Financials for this Owner
Home Financials are based on the most recent Mortgage that was taken out on this home.
Original Mortgage
$119,340
Interest Rate
7.83%
Create a Home Valuation Report for This Property
The Home Valuation Report is an in-depth analysis detailing your home's value as well as a comparison with similar homes in the area
Home Values in the Area
Average Home Value in this Area
Purchase History
| Date | Buyer | Sale Price | Title Company |
|---|---|---|---|
| The Raymond & Terri Langley 2015 Trust | -- | None Available | |
| Langley Raymond J | -- | None Available | |
| Langley Raymond J | $102,000 | Chicago Title Insurance | |
| Va | -- | First American Title Ins Co | |
| Norwest Mtg Inc | $102,282 | First American Title Co | |
| Baker Roger L | -- | -- | |
| Baker Roger L | $117,000 | Chicago Title Co |
Source: Public Records
Mortgage History
| Date | Status | Borrower | Loan Amount |
|---|---|---|---|
| Previous Owner | Langley Raymond J | $102,000 | |
| Previous Owner | Baker Roger L | $119,340 |
Source: Public Records
Tax History
| Year | Tax Paid | Tax Assessment Tax Assessment Total Assessment is a certain percentage of the fair market value that is determined by local assessors to be the total taxable value of land and additions on the property. | Land | Improvement |
|---|---|---|---|---|
| 2025 | $2,410 | $175,524 | $37,654 | $137,870 |
| 2024 | $2,331 | $172,084 | $36,916 | $135,168 |
| 2023 | $2,331 | $168,711 | $36,193 | $132,518 |
| 2022 | $2,307 | $165,405 | $35,484 | $129,921 |
| 2021 | $2,265 | $162,164 | $34,789 | $127,375 |
| 2020 | $2,265 | $160,502 | $34,433 | $126,069 |
| 2019 | $2,264 | $160,502 | $34,433 | $126,069 |
| 2018 | $2,194 | $154,272 | $33,097 | $121,175 |
| 2017 | $2,191 | $151,249 | $32,449 | $118,800 |
| 2016 | $2,089 | $148,284 | $31,813 | $116,471 |
| 2015 | $2,048 | $146,058 | $31,336 | $114,722 |
| 2014 | $2,029 | $143,199 | $30,723 | $112,476 |
Source: Public Records
Map
Nearby Homes
- 0 Mustang Dr Unit 9992982
- 0 Mustang Dr Unit 9987481
- 0 Mustang Dr Unit 9992800
- 0 Mustang Dr Unit 26000083
- 0 Mustang Dr Unit CV25131605
- 30721 Condor Place
- 30617 Buckskin Dr
- 0 Borrel Ct
- 30435 Horsethief Dr
- 0 Drake Ct
- 18611 Mustang Dr
- 0 Jacks Hill Rd Unit 9992710
- 0 Jacks Hill Rd Unit 9993706
- 0 Jacks Hill Rd Unit 9993855
- 30460 Horsethief Dr
- 19520 Quail Dr
- 0 Jack Springs Rd Unit 9985467
- 29661 Alejandro Ct
- 0 Jacks Hill
- 0 San Joaquin Dr Unit 9990132
- 19191 Mustang Dr
- 19300 Mustang Dr
- 19161 Mustang Dr
- 19150 Mustang Dr
- 19151 Mustang Dr
- 19121 Mustang Dr
- 19111 Mustang Dr
- 19101 Mustang Dr
- 19070 Mustang Dr
- 19091 Mustang Dr
- 19081 Mustang Dr
- 0 Mustang Dr Unit 625777
- 0 Mustang Dr Unit 24008100
- 0 Mustang Dr Unit 9991465
- 0 Mustang Dr Unit 24004911
- 107 Mustang Dr
- 0 Mustang Dr Unit 9990866
- 0 Mustang Dr Unit 9990078
- 0 Mustang Dr Unit 9956679
- 0 Mustang Dr Unit 26019473
Your Personal Tour Guide
Ask me questions while you tour the home.