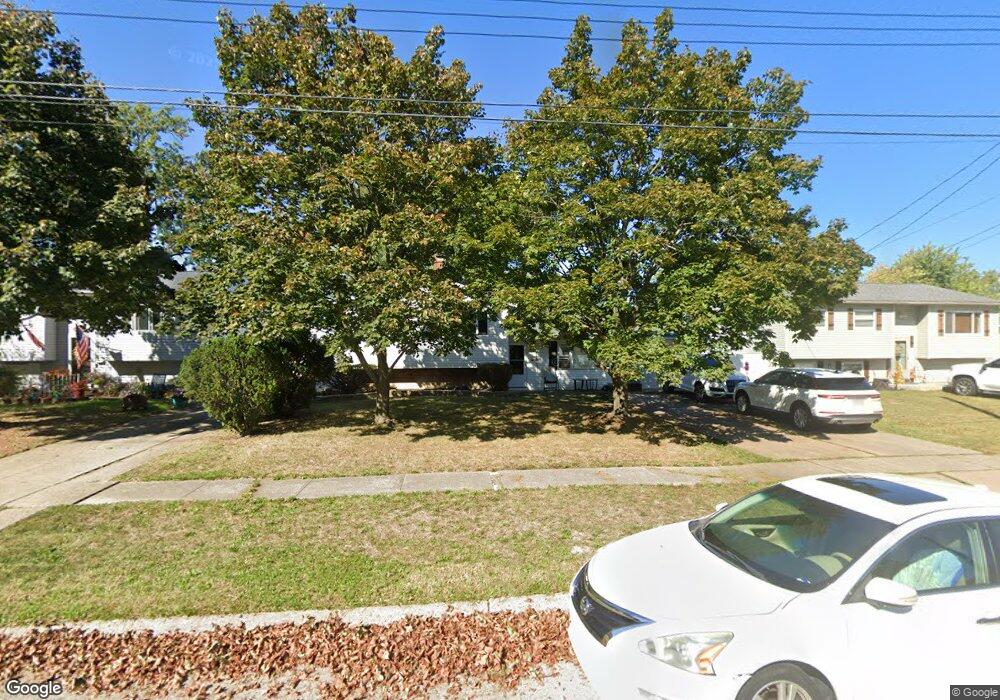
1921 E 40th St Lorain, OH 44055
Estimated Value: $157,000 - $195,000
4
Beds
3
Baths
1,312
Sq Ft
$137/Sq Ft
Est. Value
About This Home
This home is located at 1921 E 40th St, Lorain, OH 44055 and is currently estimated at $180,362, approximately $137 per square foot. 1921 E 40th St is a home located in Lorain County with nearby schools including Helen Steiner Rice Elementary School, Southview Middle School, and Lorain High School.
Ownership History
Date
Name
Owned For
Owner Type
Purchase Details
Closed on
Mar 24, 2008
Sold by
Us Bank Na
Bought by
Stone Leon C
Current Estimated Value
Home Financials for this Owner
Home Financials are based on the most recent Mortgage that was taken out on this home.
Original Mortgage
$68,918
Interest Rate
5.87%
Mortgage Type
FHA
Purchase Details
Closed on
Sep 17, 2007
Sold by
Vazquez Miguel A and Guggenbiller Nicole T
Bought by
Us Bank Na and The Registered Holders Of Asset Backed C
Purchase Details
Closed on
Jul 2, 2005
Sold by
Rodriguez Zenaida A
Bought by
Vazquez Miguel A and Guggenbiller Nicole T
Home Financials for this Owner
Home Financials are based on the most recent Mortgage that was taken out on this home.
Original Mortgage
$87,200
Interest Rate
6.92%
Mortgage Type
Fannie Mae Freddie Mac
Purchase Details
Closed on
May 22, 1998
Sold by
Laureano Ildefonso Rodriguez
Bought by
Rodriguez Zenaida A
Create a Home Valuation Report for This Property
The Home Valuation Report is an in-depth analysis detailing your home's value as well as a comparison with similar homes in the area
Home Values in the Area
Average Home Value in this Area
Purchase History
| Date | Buyer | Sale Price | Title Company |
|---|---|---|---|
| Stone Leon C | $70,000 | Nova Title Agency Inc | |
| Us Bank Na | $66,000 | None Available | |
| Vazquez Miguel A | -- | Real Living Title Agency Ltd | |
| Rodriguez Zenaida A | -- | -- |
Source: Public Records
Mortgage History
| Date | Status | Borrower | Loan Amount |
|---|---|---|---|
| Previous Owner | Stone Leon C | $68,918 | |
| Previous Owner | Vazquez Miguel A | $87,200 | |
| Closed | Vazquez Miguel A | $21,800 |
Source: Public Records
Tax History
| Year | Tax Paid | Tax Assessment Tax Assessment Total Assessment is a certain percentage of the fair market value that is determined by local assessors to be the total taxable value of land and additions on the property. | Land | Improvement |
|---|---|---|---|---|
| 2024 | $2,097 | $50,838 | $5,278 | $45,560 |
| 2023 | $1,929 | $37,457 | $5,873 | $31,584 |
| 2022 | $1,912 | $37,457 | $5,873 | $31,584 |
| 2021 | $1,912 | $37,457 | $5,873 | $31,584 |
| 2020 | $1,773 | $30,160 | $4,730 | $25,430 |
| 2019 | $1,762 | $30,160 | $4,730 | $25,430 |
| 2018 | $1,763 | $30,160 | $4,730 | $25,430 |
| 2017 | $1,601 | $25,810 | $5,610 | $20,200 |
| 2016 | $1,588 | $25,810 | $5,610 | $20,200 |
| 2015 | $1,498 | $25,810 | $5,610 | $20,200 |
| 2014 | $1,430 | $24,700 | $5,370 | $19,330 |
| 2013 | $1,390 | $24,180 | $5,370 | $18,810 |
Source: Public Records
Map
Nearby Homes
- 1927 E 40th St
- 1915 E 40th St
- 1933 E 40th St
- 1911 E 40th St
- 1918 E 39th St
- 1924 E 39th St
- 1914 E 39th St
- 1910 E 39th St
- 1930 E 39th St
- 1907 E 40th St
- 1920 E 40th St
- 1939 E 40th St
- 1916 E 40th St
- 1926 E 40th St
- 1906 E 39th St
- 1912 E 40th St
- 1936 E 39th St
- 1932 E 40th St
- 1906 E 40th St
- 4010 Shawnee Dr
Your Personal Tour Guide
Ask me questions while you tour the home.