1921 Sumter Ct Unit 2 Lawrenceville, GA 30044
Gwinnett Place NeighborhoodEstimated Value: $380,012 - $415,000
3
Beds
3
Baths
2,054
Sq Ft
$192/Sq Ft
Est. Value
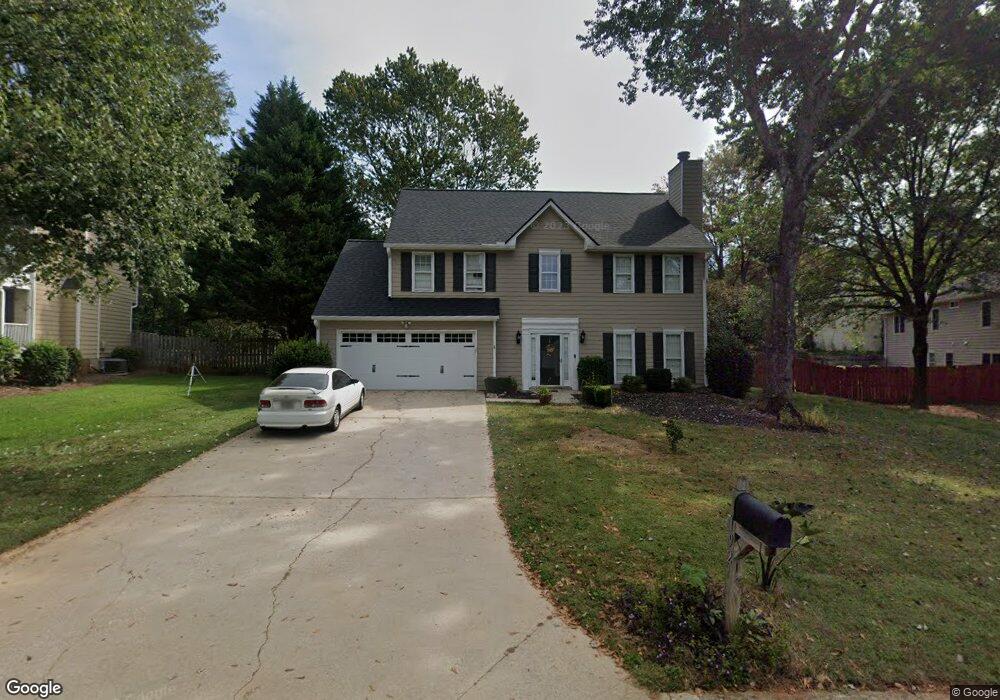
About This Home
This home is located at 1921 Sumter Ct Unit 2, Lawrenceville, GA 30044 and is currently estimated at $395,003, approximately $192 per square foot. 1921 Sumter Ct Unit 2 is a home located in Gwinnett County with nearby schools including Craig Elementary School, Alton C. Crews Middle School, and Brookwood High School.
Ownership History
Date
Name
Owned For
Owner Type
Purchase Details
Closed on
Dec 29, 2023
Sold by
Mark Christine
Bought by
Marcocci Christopher Carmen and Marcocci Mark Christine
Current Estimated Value
Purchase Details
Closed on
May 29, 2019
Sold by
Davis Sean Michael
Bought by
Mark Christine
Purchase Details
Closed on
Jul 13, 2016
Sold by
Christine
Bought by
Mark Christine and Davis Sean Michael
Purchase Details
Closed on
Sep 20, 2004
Sold by
Flores Gregory D and Flores Margaret
Bought by
Mark Joseph E and Mark Christine
Home Financials for this Owner
Home Financials are based on the most recent Mortgage that was taken out on this home.
Original Mortgage
$137,300
Interest Rate
6.12%
Purchase Details
Closed on
Sep 30, 1997
Sold by
Fredrick Matthew D and Fredrick Leiann R
Bought by
Flores Gregory D and Flores Margaret M
Home Financials for this Owner
Home Financials are based on the most recent Mortgage that was taken out on this home.
Original Mortgage
$117,400
Interest Rate
7.46%
Create a Home Valuation Report for This Property
The Home Valuation Report is an in-depth analysis detailing your home's value as well as a comparison with similar homes in the area
Home Values in the Area
Average Home Value in this Area
Purchase History
| Date | Buyer | Sale Price | Title Company |
|---|---|---|---|
| Marcocci Christopher Carmen | -- | -- | |
| Mark Christine | -- | -- | |
| Mark Christine | -- | -- | |
| Mark Joseph E | $171,700 | -- | |
| Flores Gregory D | $123,600 | -- |
Source: Public Records
Mortgage History
| Date | Status | Borrower | Loan Amount |
|---|---|---|---|
| Previous Owner | Mark Joseph E | $137,300 | |
| Previous Owner | Flores Gregory D | $117,400 |
Source: Public Records
Tax History Compared to Growth
Tax History
| Year | Tax Paid | Tax Assessment Tax Assessment Total Assessment is a certain percentage of the fair market value that is determined by local assessors to be the total taxable value of land and additions on the property. | Land | Improvement |
|---|---|---|---|---|
| 2024 | $4,091 | $142,320 | $30,000 | $112,320 |
| 2023 | $4,091 | $146,080 | $33,200 | $112,880 |
| 2022 | $3,754 | $128,680 | $30,000 | $98,680 |
| 2021 | $3,026 | $91,440 | $24,000 | $67,440 |
| 2020 | $3,046 | $91,440 | $24,000 | $67,440 |
| 2019 | $2,837 | $85,640 | $24,000 | $61,640 |
| 2018 | $2,838 | $85,640 | $24,000 | $61,640 |
| 2016 | $2,536 | $70,760 | $18,000 | $52,760 |
| 2015 | $2,407 | $64,760 | $18,000 | $46,760 |
| 2014 | $2,388 | $64,320 | $13,840 | $50,480 |
Source: Public Records
Map
Nearby Homes
- 3217 Hidden Valley Cir
- 3218 Hidden Valley Cir
- 1011 Finial Dr
- 2011 Montrose Ct
- 1930 Rocky Mill Ln
- 971 Providence Dr Unit 3
- 1810 Talbot Ct
- 803 Baugh Springs Ln
- 1931 Rocky Mill Ln
- 840 Deer Oaks Dr
- 969 Flowers Crossing
- 4105 Vicksburg Dr
- 825 Connell Ln
- 1840 Forkview Dr
- 1850 Forkview Dr
- 736 Singley Dr
- 1820 Forkview Dr
- 1931 Sumter Ct
- 729 Flowers Crossing
- 739 Flowers Crossing Unit 2
- 1941 Sumter Ct
- 911 Bonaventure Way Unit 16
- 719 Flowers Crossing
- 749 Flowers Crossing Unit 2
- 921 Bonaventure Way Unit 40
- 921 Bonaventure Way Unit 16
- 1932 Sumter Ct
- 1951 Sumter Ct
- 728 Flowers Crossing Unit 2
- 0 Sumter Ct Unit 8678452
- 0 Sumter Ct Unit 9037177
- 0 Sumter Ct Unit 8886362
- 0 Sumter Ct Unit 7357098
- 0 Sumter Ct Unit 7471530
- 0 Sumter Ct Unit 8174017
- 0 Sumter Ct Unit 8219173
- 0 Sumter Ct Unit 8494839