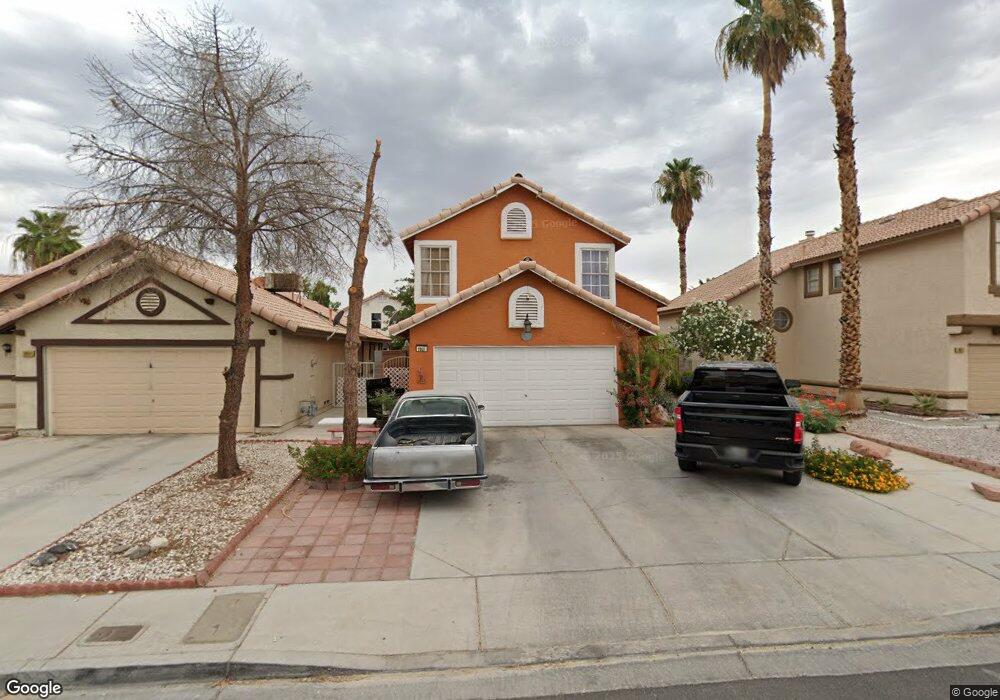
1921 Turtlerock St Las Vegas, NV 89142
Estimated Value: $363,117 - $380,000
3
Beds
3
Baths
1,372
Sq Ft
$270/Sq Ft
Est. Value
About This Home
This home is located at 1921 Turtlerock St, Las Vegas, NV 89142 and is currently estimated at $370,529, approximately $270 per square foot. 1921 Turtlerock St is a home located in Clark County with nearby schools including John F. Mendoza Elementary School, Duane D. Keller Middle School, and Las Vegas High School.
Ownership History
Date
Name
Owned For
Owner Type
Purchase Details
Closed on
Dec 7, 1999
Sold by
Xayarat Malayphon
Bought by
Becerra Adauto and Becerra Ubaldian
Current Estimated Value
Home Financials for this Owner
Home Financials are based on the most recent Mortgage that was taken out on this home.
Original Mortgage
$114,044
Interest Rate
7.96%
Mortgage Type
FHA
Purchase Details
Closed on
Nov 20, 1999
Sold by
Xayarat Oudai
Bought by
Xayarat Malayphon
Home Financials for this Owner
Home Financials are based on the most recent Mortgage that was taken out on this home.
Original Mortgage
$114,044
Interest Rate
7.96%
Mortgage Type
FHA
Purchase Details
Closed on
Jun 2, 1998
Sold by
Olson D Gregory and Olson Allison M
Bought by
Xayarat Oudai and Xayarat Malayphon
Home Financials for this Owner
Home Financials are based on the most recent Mortgage that was taken out on this home.
Original Mortgage
$88,800
Interest Rate
8.29%
Create a Home Valuation Report for This Property
The Home Valuation Report is an in-depth analysis detailing your home's value as well as a comparison with similar homes in the area
Home Values in the Area
Average Home Value in this Area
Purchase History
| Date | Buyer | Sale Price | Title Company |
|---|---|---|---|
| Becerra Adauto | $115,550 | National Title Company | |
| Xayarat Malayphon | -- | National Title Company | |
| Xayarat Oudai | $111,000 | Old Republic Title Company |
Source: Public Records
Mortgage History
| Date | Status | Borrower | Loan Amount |
|---|---|---|---|
| Previous Owner | Becerra Adauto | $114,044 | |
| Previous Owner | Xayarat Oudai | $88,800 | |
| Closed | Xayarat Oudai | $22,200 |
Source: Public Records
Tax History Compared to Growth
Tax History
| Year | Tax Paid | Tax Assessment Tax Assessment Total Assessment is a certain percentage of the fair market value that is determined by local assessors to be the total taxable value of land and additions on the property. | Land | Improvement |
|---|---|---|---|---|
| 2025 | $898 | $59,589 | $22,750 | $36,839 |
| 2024 | $872 | $59,589 | $22,750 | $36,839 |
| 2023 | $872 | $64,217 | $28,700 | $35,517 |
| 2022 | $847 | $53,665 | $21,000 | $32,665 |
| 2021 | $823 | $50,217 | $18,900 | $31,317 |
| 2020 | $796 | $49,830 | $18,550 | $31,280 |
| 2019 | $772 | $45,038 | $14,000 | $31,038 |
| 2018 | $750 | $43,178 | $13,300 | $29,878 |
| 2017 | $1,230 | $41,941 | $11,550 | $30,391 |
| 2016 | $711 | $37,868 | $7,350 | $30,518 |
| 2015 | $709 | $28,009 | $6,300 | $21,709 |
| 2014 | $688 | $22,763 | $5,250 | $17,513 |
Source: Public Records
Map
Nearby Homes
- 1950 Turtlerock St
- 5849 Emerald Canyon Dr
- 1927 Raspberry Hill Rd
- 1747 Angel Falls St
- 2179 Raspberry Hill Rd
- 1631 Mapleleaf St
- 1779 Pineapple Tree Ct
- 2307 Tuscarora Ct
- 6092 Golden Nectar Way
- 6058 Grape Blossom Ave
- 6053 Wild Berry Dr
- 6131 Pumpkin Patch Ave
- 6094 Bing Cherry Dr
- 5913 Autumn Harvest Ave
- 2229 Bowstring Dr
- 1841 Skywood Way
- 6028 Las Nubes Dr
- 6080 Saint Petersburg Dr
- 6233 Apple Orchard Dr
- 6276 Back Woods Rd
- 1911 Turtlerock St
- 1931 Turtlerock St
- 1901 Turtlerock St
- 1941 Turtlerock St
- 1932 Falcon Ridge St
- 1912 Falcon Ridge St
- 1891 Turtlerock St
- 1951 Turtlerock St
- 1942 Falcon Ridge St
- 1902 Falcon Ridge St
- 1920 Turtlerock St
- 1910 Turtlerock St
- 1910 Turtlerock St
- 1952 Falcon Ridge St
- 1930 Turtlerock St
- 1881 Turtlerock St
- 1961 Turtlerock St
- 1900 Turtlerock St
- 1940 Turtlerock St
- 1962 Falcon Ridge St