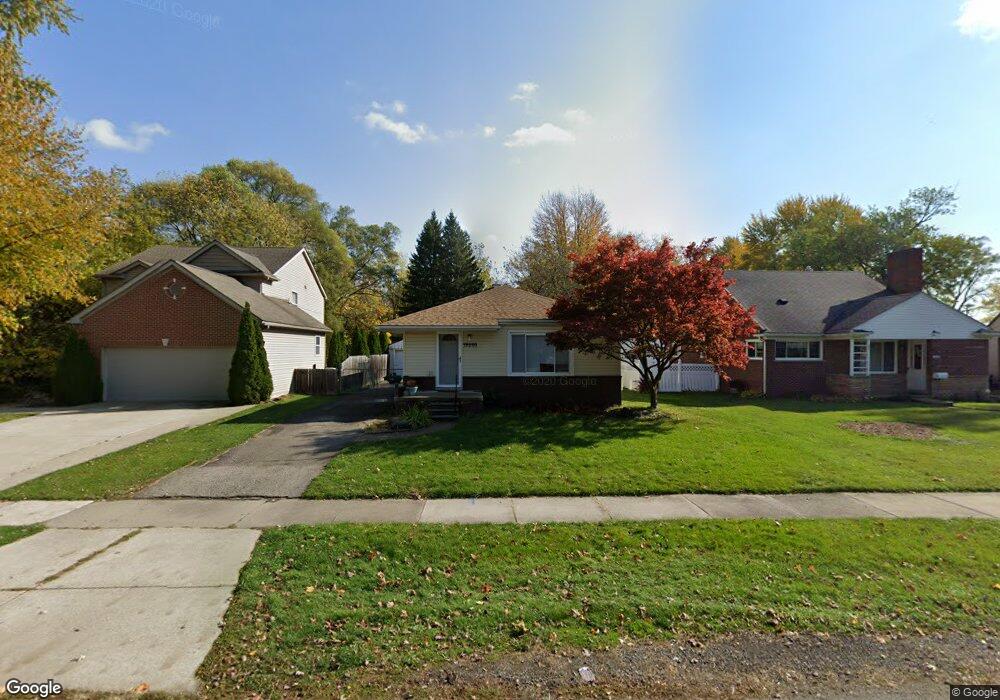
19210 Denby Redford, MI 48240
Estimated Value: $164,000 - $175,000
3
Beds
2
Baths
1,014
Sq Ft
$167/Sq Ft
Est. Value
About This Home
This home is located at 19210 Denby, Redford, MI 48240 and is currently estimated at $169,186, approximately $166 per square foot. 19210 Denby is a home located in Wayne County with nearby schools including Beech Elementary School, Hilbert Middle School, and Redford Union High School.
Ownership History
Date
Name
Owned For
Owner Type
Purchase Details
Closed on
Mar 31, 2015
Sold by
Fsadni Leslie L and Nelson Leslie
Bought by
Nelson Charles William
Current Estimated Value
Purchase Details
Closed on
May 19, 2006
Sold by
Velez Samuel A and Velez Kerri A
Bought by
Fsadni Leslie
Home Financials for this Owner
Home Financials are based on the most recent Mortgage that was taken out on this home.
Original Mortgage
$26,400
Outstanding Balance
$15,564
Interest Rate
6.62%
Mortgage Type
Stand Alone Second
Estimated Equity
$153,622
Purchase Details
Closed on
Jul 31, 2001
Sold by
Kochan Michele
Bought by
Velez Kerri A
Create a Home Valuation Report for This Property
The Home Valuation Report is an in-depth analysis detailing your home's value as well as a comparison with similar homes in the area
Home Values in the Area
Average Home Value in this Area
Purchase History
| Date | Buyer | Sale Price | Title Company |
|---|---|---|---|
| Nelson Charles William | -- | None Available | |
| Fsadni Leslie | $132,000 | Metropolitan Title Company | |
| Velez Kerri A | $129,900 | -- |
Source: Public Records
Mortgage History
| Date | Status | Borrower | Loan Amount |
|---|---|---|---|
| Open | Fsadni Leslie | $26,400 | |
| Open | Fsadni Leslie | $105,600 |
Source: Public Records
Tax History Compared to Growth
Tax History
| Year | Tax Paid | Tax Assessment Tax Assessment Total Assessment is a certain percentage of the fair market value that is determined by local assessors to be the total taxable value of land and additions on the property. | Land | Improvement |
|---|---|---|---|---|
| 2025 | $788 | $80,200 | $0 | $0 |
| 2024 | $788 | $77,200 | $0 | $0 |
| 2023 | $751 | $61,600 | $0 | $0 |
| 2022 | $1,880 | $52,900 | $0 | $0 |
| 2021 | $1,828 | $49,100 | $0 | $0 |
| 2020 | $1,803 | $40,800 | $0 | $0 |
| 2019 | $1,764 | $37,200 | $0 | $0 |
| 2018 | $677 | $28,300 | $0 | $0 |
| 2017 | $1,748 | $26,100 | $0 | $0 |
| 2016 | $1,722 | $24,600 | $0 | $0 |
| 2015 | $2,377 | $24,100 | $0 | $0 |
| 2013 | $2,340 | $24,400 | $0 | $0 |
| 2012 | $1,641 | $28,000 | $6,300 | $21,700 |
Source: Public Records
Map
Nearby Homes