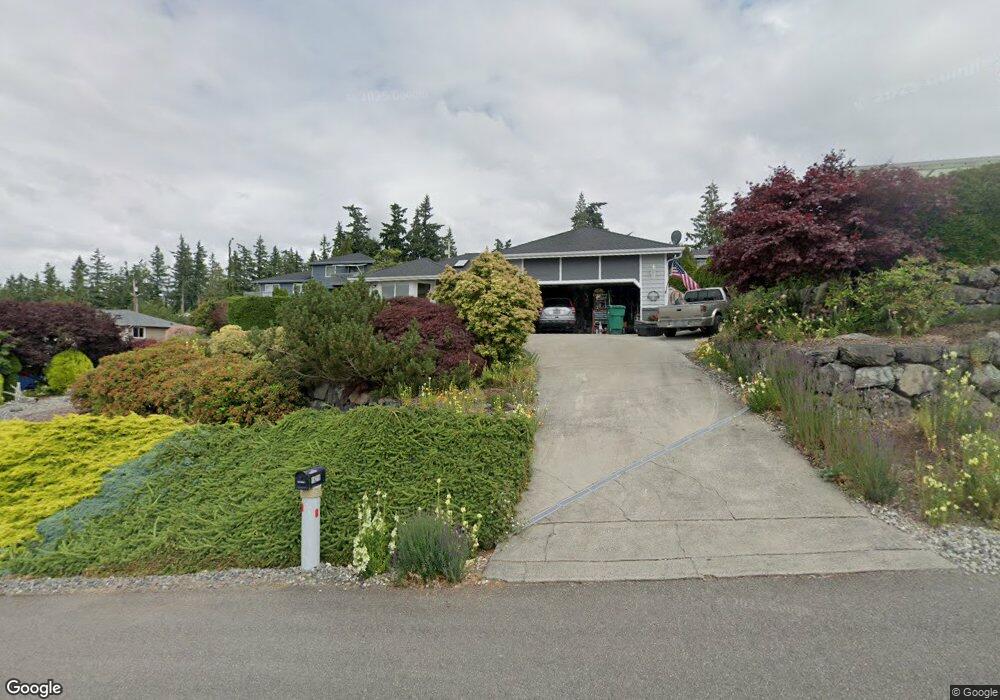
19219 95th Ave NW Stanwood, WA 98292
Warm Beach NeighborhoodEstimated Value: $696,675 - $812,000
3
Beds
2
Baths
1,555
Sq Ft
$469/Sq Ft
Est. Value
About This Home
This home is located at 19219 95th Ave NW, Stanwood, WA 98292 and is currently estimated at $728,919, approximately $468 per square foot. 19219 95th Ave NW is a home located in Snohomish County with nearby schools including Stanwood Elementary School, Port Susan Middle School, and Stanwood High School.
Ownership History
Date
Name
Owned For
Owner Type
Purchase Details
Closed on
Nov 18, 2013
Sold by
Hughes Susan Lynn and Hughes David Charles
Bought by
Hughes Susan Lynn and Hughes David Charles
Current Estimated Value
Home Financials for this Owner
Home Financials are based on the most recent Mortgage that was taken out on this home.
Original Mortgage
$190,000
Outstanding Balance
$140,958
Interest Rate
4.1%
Mortgage Type
New Conventional
Estimated Equity
$587,961
Purchase Details
Closed on
Feb 7, 2011
Sold by
Schimpf Wilbur C
Bought by
Schimpf Susan L
Purchase Details
Closed on
Feb 12, 1997
Sold by
Maddy Construction Inc
Bought by
Schimpf Wilbur C and Schimpf Susan L
Home Financials for this Owner
Home Financials are based on the most recent Mortgage that was taken out on this home.
Original Mortgage
$119,950
Interest Rate
7.16%
Purchase Details
Closed on
Jul 11, 1996
Sold by
Giles Teresa K and Gillihan Kristi G
Bought by
Maddy Construction Inc
Create a Home Valuation Report for This Property
The Home Valuation Report is an in-depth analysis detailing your home's value as well as a comparison with similar homes in the area
Home Values in the Area
Average Home Value in this Area
Purchase History
| Date | Buyer | Sale Price | Title Company |
|---|---|---|---|
| Hughes Susan Lynn | -- | Chicago Title | |
| Schimpf Susan L | $71,834 | Chicago | |
| Schimpf Wilbur C | $159,950 | Chicago Title Insurance Co | |
| Maddy Construction Inc | $100,000 | Chicago Title Insurance |
Source: Public Records
Mortgage History
| Date | Status | Borrower | Loan Amount |
|---|---|---|---|
| Open | Hughes Susan Lynn | $190,000 | |
| Closed | Schimpf Wilbur C | $119,950 | |
| Closed | Schimpf Wilbur C | $20,000 |
Source: Public Records
Tax History Compared to Growth
Tax History
| Year | Tax Paid | Tax Assessment Tax Assessment Total Assessment is a certain percentage of the fair market value that is determined by local assessors to be the total taxable value of land and additions on the property. | Land | Improvement |
|---|---|---|---|---|
| 2025 | $4,867 | $629,500 | $281,100 | $348,400 |
| 2024 | $4,867 | $588,200 | $243,500 | $344,700 |
| 2023 | $4,933 | $630,100 | $273,600 | $356,500 |
| 2022 | $5,079 | $525,600 | $238,300 | $287,300 |
| 2020 | $4,649 | $442,500 | $188,600 | $253,900 |
| 2019 | $4,202 | $412,500 | $173,400 | $239,100 |
| 2018 | $4,010 | $363,600 | $139,700 | $223,900 |
| 2017 | $3,473 | $329,100 | $115,000 | $214,100 |
| 2016 | $3,399 | $311,300 | $105,000 | $206,300 |
| 2015 | $3,228 | $283,100 | $100,000 | $183,100 |
| 2013 | $2,894 | $237,800 | $84,000 | $153,800 |
Source: Public Records
Map
Nearby Homes
- 19422 Soundview Dr NW
- 18826 94th Dr NW
- 18815 Clarence Ave
- 9003 196th Place NW
- 19904 Soundview Dr NW
- 0 NHNB Clarence Ave
- 0 NHNA Clarence Ave
- 8817 Lakewood Rd
- 18612 98th Ave NW
- 8203 Lakewood Rd
- 17930 82nd Dr NW
- 7519 184th St NW
- 20909 Frank Waters Rd
- 16906 Marine Dr
- 16818 Marine Dr
- 21426 81st Ave NW
- The Sylvia Plan at Warm Beach Heights
- 690 X Olive Ave
- 6901 Olive Ave
- 6828 Olive Ave
- 19216 94th Dr NW
- 19231 95th Ave NW
- 19224 94th Dr NW
- 19208 94th Dr NW
- 19206 95th Ave NW
- 19230 95th Ave NW
- 19302 94th Dr NW
- 19307 95th Ave NW
- 19221 94th Dr NW
- 19223 96th Ave NW
- 9531 192nd St NW
- 19209 94th Dr NW
- 19308 95th Ave NW
- 19314 94th Dr NW
- 19301 96th Ave NW
- 9418 192nd St NW
- 19305 94th Dr NW
- 9510 192nd St NW
- 19321 95th Ave NW