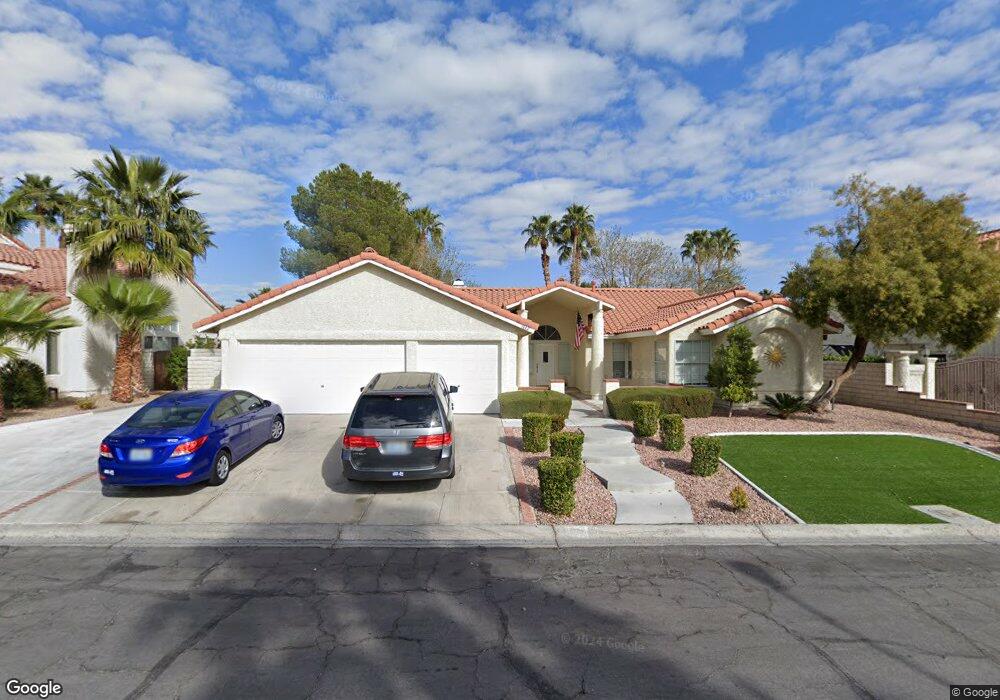
1922 Spode Ave Henderson, NV 89014
Green Valley North NeighborhoodEstimated Value: $511,726 - $570,000
3
Beds
3
Baths
2,288
Sq Ft
$237/Sq Ft
Est. Value
About This Home
This home is located at 1922 Spode Ave, Henderson, NV 89014 and is currently estimated at $541,932, approximately $236 per square foot. 1922 Spode Ave is a home located in Clark County with nearby schools including Estes M Mcdoniel Elementary School, Barbara and Hank Greenspun Junior High School, and Green Valley High School.
Ownership History
Date
Name
Owned For
Owner Type
Purchase Details
Closed on
Apr 10, 2024
Sold by
Creamer Marcia Lee and Creamer Paula Marie
Bought by
Paula Marie Creamer And Marcia Lee Creamer Re
Current Estimated Value
Purchase Details
Closed on
Mar 22, 2019
Sold by
Moyer Marcia
Bought by
Creamer Marcia and Creamer Paula
Purchase Details
Closed on
Aug 9, 2010
Sold by
Miller Deborah
Bought by
Moyer Marcia
Home Financials for this Owner
Home Financials are based on the most recent Mortgage that was taken out on this home.
Original Mortgage
$100,000
Interest Rate
4.45%
Mortgage Type
New Conventional
Purchase Details
Closed on
Jul 22, 2006
Sold by
Miller Deborah and Foster Randall
Bought by
Foster Randall and Miller Deborah
Home Financials for this Owner
Home Financials are based on the most recent Mortgage that was taken out on this home.
Original Mortgage
$225,000
Interest Rate
6.44%
Mortgage Type
New Conventional
Purchase Details
Closed on
Jul 13, 2000
Sold by
Foster Randall M
Bought by
Miller Deborah A
Create a Home Valuation Report for This Property
The Home Valuation Report is an in-depth analysis detailing your home's value as well as a comparison with similar homes in the area
Home Values in the Area
Average Home Value in this Area
Purchase History
| Date | Buyer | Sale Price | Title Company |
|---|---|---|---|
| Paula Marie Creamer And Marcia Lee Creamer Re | -- | None Listed On Document | |
| Creamer Marcia | -- | None Available | |
| Moyer Marcia | $150,000 | Netco | |
| Foster Randall | -- | First American Title Ins Co | |
| Miller Deborah A | $200,000 | -- |
Source: Public Records
Mortgage History
| Date | Status | Borrower | Loan Amount |
|---|---|---|---|
| Previous Owner | Moyer Marcia | $100,000 | |
| Previous Owner | Foster Randall | $225,000 |
Source: Public Records
Tax History
| Year | Tax Paid | Tax Assessment Tax Assessment Total Assessment is a certain percentage of the fair market value that is determined by local assessors to be the total taxable value of land and additions on the property. | Land | Improvement |
|---|---|---|---|---|
| 2026 | $2,376 | $118,421 | $53,200 | $65,221 |
| 2025 | $2,306 | $121,220 | $54,250 | $66,970 |
| 2024 | $2,239 | $121,220 | $54,250 | $66,970 |
| 2023 | $2,239 | $120,134 | $55,475 | $64,659 |
| 2022 | $2,198 | $102,034 | $42,350 | $59,684 |
| 2021 | $2,694 | $99,573 | $42,350 | $57,223 |
| 2020 | $2,499 | $99,121 | $42,000 | $57,121 |
| 2019 | $2,342 | $93,730 | $37,100 | $56,630 |
| 2018 | $2,235 | $84,752 | $29,750 | $55,002 |
| 2017 | $2,491 | $85,932 | $29,750 | $56,182 |
| 2016 | $2,092 | $83,628 | $26,950 | $56,678 |
| 2015 | $2,088 | $83,176 | $26,950 | $56,226 |
| 2014 | $2,027 | $67,879 | $17,500 | $50,379 |
Source: Public Records
Map
Nearby Homes
- 1908 Ginori Ct
- 2050 W Warm Springs Rd Unit 4323
- 2050 W Warm Springs Rd Unit 3722
- 2050 W Warm Springs Rd Unit 312
- 2050 W Warm Springs Rd Unit 2024
- 2050 W Warm Springs Rd Unit 423
- 2050 W Warm Springs Rd Unit 1723
- 2050 W Warm Springs Rd Unit 3721
- 2050 W Warm Springs Rd Unit 4322
- 2050 W Warm Springs Rd Unit 3311
- 2050 W Warm Springs Rd Unit 1121
- 2050 W Warm Springs Rd Unit 3624
- 2220 Marlboro Dr
- 372 Rushing Creek Ct
- 2231 Marlboro Dr
- 439 Indigo Springs St
- 2329 Richard Dr
- 409 Indigo Springs St
- 542 Cervantes Dr
- 405 Donner Pass Dr
- 1924 Spode Ave
- 1920 Spode Ave
- 1921 Dresden Ct
- 1923 Dresden Ct
- 1926 Spode Ave
- 1919 Spode Ave
- 1923 Spode Ave
- 1925 Dresden Ct
- 1917 Spode Ave
- 404 Limoges Terrace
- 1925 Spode Ave
- 402 Limoges Terrace
- 1928 Spode Ave
- 406 Limoges Terrace
- 400 Limoges Terrace Unit 3
- 400 Limoges Te Terrace
- 1927 Dresden Ct
- 1915 Spode Ave
- 1924 Dresden Ct
- 1927 Spode Ave
Your Personal Tour Guide
Ask me questions while you tour the home.