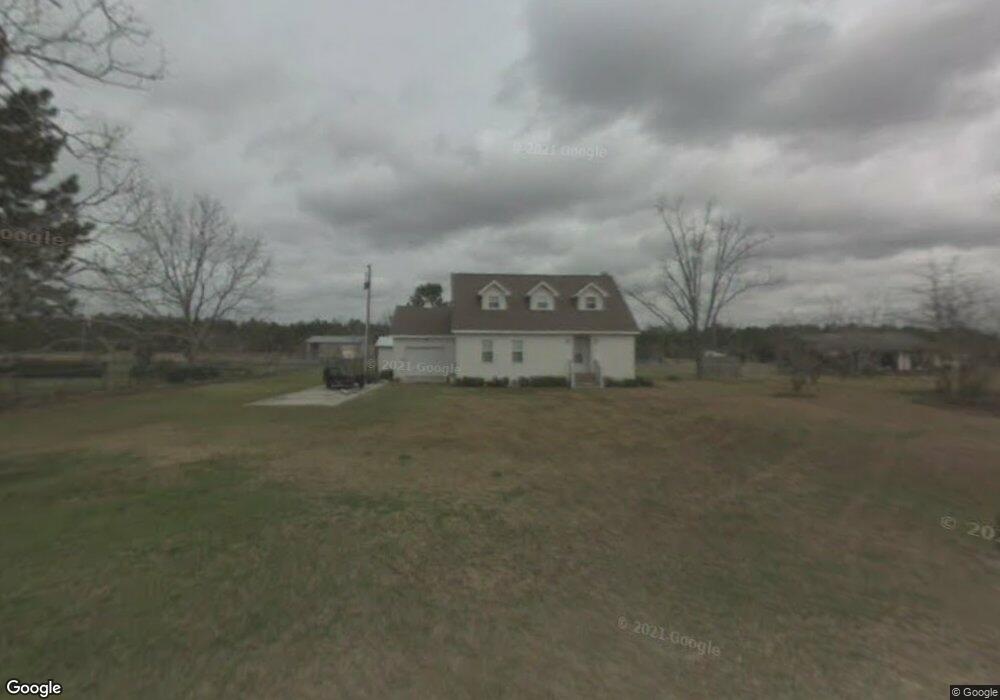
1922 Ternest Rd Waycross, GA 31503
Estimated Value: $226,000 - $270,000
3
Beds
3
Baths
1,741
Sq Ft
$141/Sq Ft
Est. Value
About This Home
This home is located at 1922 Ternest Rd, Waycross, GA 31503 and is currently estimated at $245,024, approximately $140 per square foot. 1922 Ternest Rd is a home located in Ware County with nearby schools including Wacona Elementary School, Ware County Middle School, and Ware County High School.
Ownership History
Date
Name
Owned For
Owner Type
Purchase Details
Closed on
Dec 16, 2020
Sold by
Stephens Taylor Merrell
Bought by
Padgett Derek Anthony and Padgett Shelby Nicole
Current Estimated Value
Home Financials for this Owner
Home Financials are based on the most recent Mortgage that was taken out on this home.
Original Mortgage
$145,319
Outstanding Balance
$129,377
Interest Rate
2.7%
Mortgage Type
FHA
Estimated Equity
$115,647
Purchase Details
Closed on
May 31, 2012
Sold by
Thrift Leroy F
Bought by
Moore Richard H and Moore Damita G
Home Financials for this Owner
Home Financials are based on the most recent Mortgage that was taken out on this home.
Original Mortgage
$96,428
Interest Rate
3.84%
Mortgage Type
New Conventional
Purchase Details
Closed on
Aug 3, 2011
Sold by
Thrift Leroy F
Bought by
Thrift Leroy F
Purchase Details
Closed on
May 13, 1987
Bought by
Thrift Mary H
Create a Home Valuation Report for This Property
The Home Valuation Report is an in-depth analysis detailing your home's value as well as a comparison with similar homes in the area
Home Values in the Area
Average Home Value in this Area
Purchase History
| Date | Buyer | Sale Price | Title Company |
|---|---|---|---|
| Padgett Derek Anthony | $148,000 | -- | |
| Moore Richard H | $94,500 | -- | |
| Thrift Leroy F | -- | -- | |
| Thrift Mary H | -- | -- |
Source: Public Records
Mortgage History
| Date | Status | Borrower | Loan Amount |
|---|---|---|---|
| Open | Padgett Derek Anthony | $145,319 | |
| Previous Owner | Moore Richard H | $96,428 |
Source: Public Records
Tax History Compared to Growth
Tax History
| Year | Tax Paid | Tax Assessment Tax Assessment Total Assessment is a certain percentage of the fair market value that is determined by local assessors to be the total taxable value of land and additions on the property. | Land | Improvement |
|---|---|---|---|---|
| 2024 | $2,022 | $84,715 | $1,206 | $83,509 |
| 2023 | $2,063 | $81,581 | $1,800 | $79,781 |
| 2022 | $2,349 | $81,360 | $1,800 | $79,560 |
| 2021 | $1,857 | $62,346 | $1,800 | $60,546 |
| 2020 | $1,793 | $56,541 | $1,800 | $54,741 |
| 2019 | $1,632 | $50,484 | $1,800 | $48,684 |
| 2018 | $1,175 | $38,008 | $1,800 | $36,208 |
| 2017 | $1,174 | $38,008 | $1,800 | $36,208 |
| 2016 | $1,174 | $38,008 | $1,800 | $36,208 |
| 2015 | $1,185 | $38,008 | $1,800 | $36,208 |
| 2014 | $1,183 | $38,008 | $1,800 | $36,208 |
| 2013 | -- | $38,008 | $1,800 | $36,208 |
Source: Public Records
Map
Nearby Homes
- 4190 Church Street Extension
- 1691 Huckaby Rd
- 3825 Jamestown Rd
- 3860 Blalock Ave
- 3648 Tanner Ln
- 1621 Meadowood Dr
- 5802 River Trail
- 5768 Holly Dr
- 5927 Yellow Bluff Rd
- 123 Winn Clay Dr
- 6005 & 6007 Tree Top Ln
- 06 Alton Cir
- 03 Alton Cir
- 02 Alton Cir
- 04 Alton Cir
- 01 Alton Cir
- 2508 Mesa Rd
- 1344 River Landing Way
- Tract 2,3 Stetson Dr
- 6121 Fairway Oaks Way
- 1940 Ternest Rd
- 1900 Ternest Rd
- 1976 Ternest Rd
- 2038 Ternest Rd
- 4234 Abc Ave
- 1800 Ternest Rd
- 1907 Honeysuckle Ln
- 4303 Jamestown Rd
- 4249 Jamestown Rd
- 1953 Honeysuckle Ln
- 4391 Jamestown Rd
- 4215 Jamestown Rd
- 4270 Gloria Ave
- 4260 Gloria Ave
- 4250 Gloria Ave
- 1971 Honeysuckle Ln
- 4195 Jamestown Rd
- 4277 Gloria Ave
- 4210 Gloria Ave
- 4177 Jamestown Rd