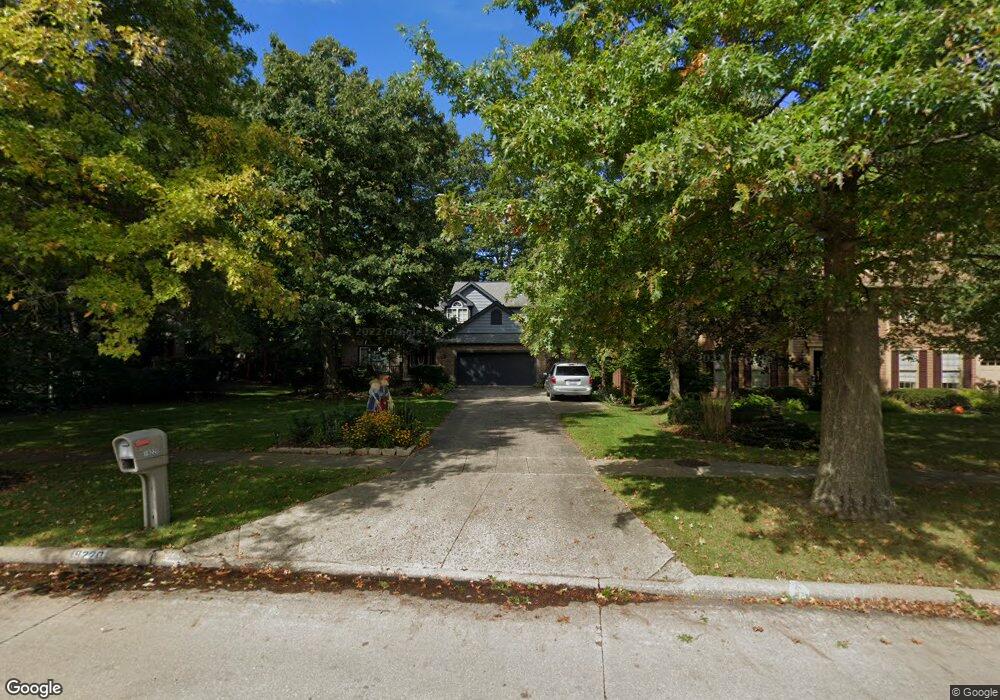
19220 Tanglewood Dr North Royalton, OH 44133
Estimated Value: $408,589 - $441,000
4
Beds
3
Baths
2,466
Sq Ft
$174/Sq Ft
Est. Value
About This Home
This home is located at 19220 Tanglewood Dr, North Royalton, OH 44133 and is currently estimated at $428,397, approximately $173 per square foot. 19220 Tanglewood Dr is a home located in Cuyahoga County with nearby schools including North Royalton Middle School, North Royalton High School, and Royal Redeemer Lutheran School.
Ownership History
Date
Name
Owned For
Owner Type
Purchase Details
Closed on
Jun 19, 2020
Sold by
Boening Richard and Boening Donna
Bought by
Boening Donna L and Donna L Boening Declaration Of
Current Estimated Value
Purchase Details
Closed on
May 16, 1996
Sold by
Leone Roberto S
Bought by
Boening Richard and Boening Donna
Home Financials for this Owner
Home Financials are based on the most recent Mortgage that was taken out on this home.
Original Mortgage
$169,200
Interest Rate
7.86%
Mortgage Type
New Conventional
Purchase Details
Closed on
May 28, 1993
Sold by
Corso Robert W
Bought by
Leone Roberto S
Purchase Details
Closed on
Oct 16, 1991
Bought by
Corso Robert W
Purchase Details
Closed on
Apr 12, 1991
Bought by
Briarwood Homes, Inc.
Purchase Details
Closed on
Jan 1, 1988
Bought by
Dean Homes Inc
Create a Home Valuation Report for This Property
The Home Valuation Report is an in-depth analysis detailing your home's value as well as a comparison with similar homes in the area
Home Values in the Area
Average Home Value in this Area
Purchase History
| Date | Buyer | Sale Price | Title Company |
|---|---|---|---|
| Boening Donna L | -- | None Available | |
| Boening Richard | $211,500 | -- | |
| Leone Roberto S | $212,000 | -- | |
| Corso Robert W | $204,200 | -- | |
| Briarwood Homes, Inc. | -- | -- | |
| Dean Homes Inc | -- | -- |
Source: Public Records
Mortgage History
| Date | Status | Borrower | Loan Amount |
|---|---|---|---|
| Closed | Boening Richard | $169,200 |
Source: Public Records
Tax History Compared to Growth
Tax History
| Year | Tax Paid | Tax Assessment Tax Assessment Total Assessment is a certain percentage of the fair market value that is determined by local assessors to be the total taxable value of land and additions on the property. | Land | Improvement |
|---|---|---|---|---|
| 2024 | $7,290 | $125,510 | $24,850 | $100,660 |
| 2023 | $5,464 | $86,280 | $23,660 | $62,620 |
| 2022 | $6,031 | $95,870 | $23,660 | $72,210 |
| 2021 | $6,094 | $95,870 | $23,660 | $72,210 |
| 2020 | $5,389 | $80,570 | $19,880 | $60,690 |
| 2019 | $5,813 | $255,800 | $56,800 | $199,000 |
| 2018 | $5,875 | $89,530 | $19,880 | $69,650 |
| 2017 | $5,344 | $77,780 | $14,740 | $63,040 |
| 2016 | $5,008 | $77,780 | $14,740 | $63,040 |
| 2015 | $4,899 | $77,780 | $14,740 | $63,040 |
| 2014 | $4,899 | $75,500 | $14,320 | $61,180 |
Source: Public Records
Map
Nearby Homes
- 18680 Bennett Rd
- 13335 Tradewinds Dr
- 11886 Friar Post
- 13448 Compass Point Dr
- 19297 Hunt Rd
- 19252 Hidden Woods Ln
- 10244 Hidden Valley Dr
- 204 Brookside Blvd
- 14292 Trenton Ave
- 236 E Hartford Dr
- 14390 Hastings Ct
- 2160 Boston Rd Unit B
- 2160 Boston Rd Unit AB
- 95 Valley Brook Blvd
- 14452 Trenton Ave
- 0 V L Boston Rd Unit 5138046
- 17390 Bennett Rd
- 106 Briarleigh Dr
- 10281 River Run Ln
- 20745 Evergreen Trail
- 19210 Tanglewood Dr
- 19230 Tanglewood Dr
- 19190 Tanglewood Dr
- 12913 Kingston Way
- 13151 Morning Star Dr
- 12923 Kingston Way
- 12903 Kingston Way
- 19180 Tanglewood Dr
- 19250 Tanglewood Dr
- 12761 Cottonwood Ln
- 12933 Kingston Way
- 13141 Morning Star Dr
- 12893 Kingston Way
- 12751 Cottonwood Ln
- 19161 Tanglewood Dr
- 13050 Morning Star Dr
- 19170 Tanglewood Dr
- 19260 Tanglewood Dr
- 12741 Cottonwood Ln
- 12883 Kingston Way