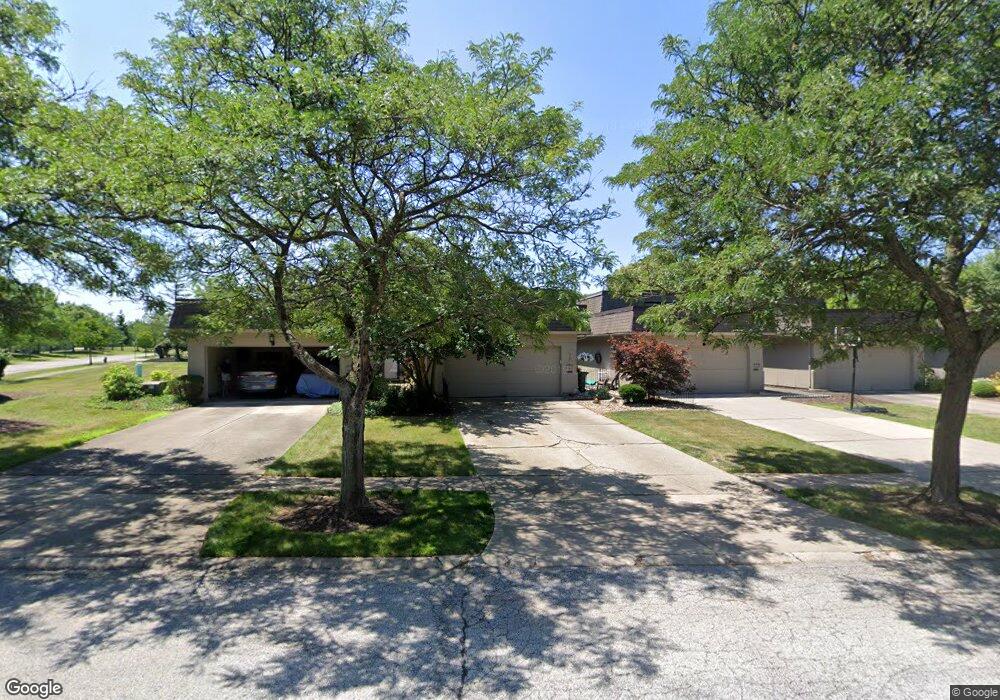
19225 Briarwood Ln Unit 2 Strongsville, OH 44149
Estimated Value: $226,000 - $262,000
3
Beds
3
Baths
1,610
Sq Ft
$156/Sq Ft
Est. Value
About This Home
This home is located at 19225 Briarwood Ln Unit 2, Strongsville, OH 44149 and is currently estimated at $250,433, approximately $155 per square foot. 19225 Briarwood Ln Unit 2 is a home located in Cuyahoga County with nearby schools including Strongsville High School and Sts Joseph & John Interparochial School.
Ownership History
Date
Name
Owned For
Owner Type
Purchase Details
Closed on
Nov 2, 2004
Sold by
Nowak Jadwiga and Janning Fred
Bought by
Palusinski Ireneusz
Current Estimated Value
Home Financials for this Owner
Home Financials are based on the most recent Mortgage that was taken out on this home.
Original Mortgage
$140,650
Outstanding Balance
$70,329
Interest Rate
5.81%
Mortgage Type
FHA
Estimated Equity
$180,104
Purchase Details
Closed on
Sep 20, 2001
Sold by
Clement Julie and Clement Stanley
Bought by
Nowak Jadwiga
Purchase Details
Closed on
Jan 7, 2000
Sold by
Estate Of Mary Ethel Mortland
Bought by
Clement Julie and Clement Stanley
Purchase Details
Closed on
Dec 1, 1977
Sold by
Salvation Army
Bought by
Mortland Mary Ethel
Purchase Details
Closed on
Jan 1, 1975
Bought by
Salvation Army
Create a Home Valuation Report for This Property
The Home Valuation Report is an in-depth analysis detailing your home's value as well as a comparison with similar homes in the area
Home Values in the Area
Average Home Value in this Area
Purchase History
| Date | Buyer | Sale Price | Title Company |
|---|---|---|---|
| Palusinski Ireneusz | $145,000 | Lawyers Title | |
| Nowak Jadwiga | $118,500 | Lawyers Title Ins Corp | |
| Clement Julie | -- | -- | |
| Mortland Mary Ethel | $58,900 | -- | |
| Salvation Army | -- | -- |
Source: Public Records
Mortgage History
| Date | Status | Borrower | Loan Amount |
|---|---|---|---|
| Open | Palusinski Ireneusz | $140,650 |
Source: Public Records
Tax History Compared to Growth
Tax History
| Year | Tax Paid | Tax Assessment Tax Assessment Total Assessment is a certain percentage of the fair market value that is determined by local assessors to be the total taxable value of land and additions on the property. | Land | Improvement |
|---|---|---|---|---|
| 2024 | $3,399 | $72,380 | $7,245 | $65,135 |
| 2023 | $3,404 | $54,360 | $5,430 | $48,930 |
| 2022 | $3,379 | $54,360 | $5,430 | $48,930 |
| 2021 | $3,352 | $54,360 | $5,430 | $48,930 |
| 2020 | $3,158 | $45,290 | $4,520 | $40,780 |
| 2019 | $3,065 | $129,400 | $12,900 | $116,500 |
| 2018 | $2,575 | $45,290 | $4,520 | $40,780 |
| 2017 | $2,413 | $36,370 | $3,640 | $32,730 |
| 2016 | $2,393 | $36,370 | $3,640 | $32,730 |
| 2015 | $2,609 | $36,370 | $3,640 | $32,730 |
| 2014 | $2,609 | $39,100 | $3,920 | $35,180 |
Source: Public Records
Map
Nearby Homes
- 19240 Briarwood Ln
- 11432 Pearl Rd
- 11179 Fawn Meadow Ln
- 11499 Pearl Rd Unit A106
- 11479 Pearl Rd Unit A101
- 10986 Fawn Meadow Ln
- 19890 Idlewood Trail
- 19997 Idlewood Trail
- 20050 Idlewood Trail
- 12539 Olympus Way
- 18336 Falling Water Rd
- 20424 Scotch Pine Way
- 12647 Edgepark Cir
- 12694 Ionia Ct
- 11650 River Moss Rd
- 18438 Meadow Ln
- 19767 Dell Dr
- 20684 Albion Rd
- 13066 Olympus Way
- 13099 Olympus Way
- 19229 Briarwood Ln Unit 3
- 19231 Briarwood Ln
- 19221 Briarwood Ln
- 19235 Briarwood Ln
- 19235 Briarwood 5c 6 Ln
- 19222 Heather Ln Unit C75
- 19228 Heather Ln
- 19236 Heather Ln
- 19242 Heather Ln Unit C72
- 19242 Heather Ln Unit C-7
- 19266 Heather Ln Unit A/81
- 19260 Heather Ln Unit A/82
- 19254 Heather Ln Unit A/83
- 19260 Heather Ln Unit A8
- 19254 Heather Ln Unit A8
- 19248 Heather Ln
- 19239 Briarwood Ln Unit 1
- 19251 Briarwood Ln
- 19245 Briarwood Ln
- 19239 Briarwood Ln Unit 19239