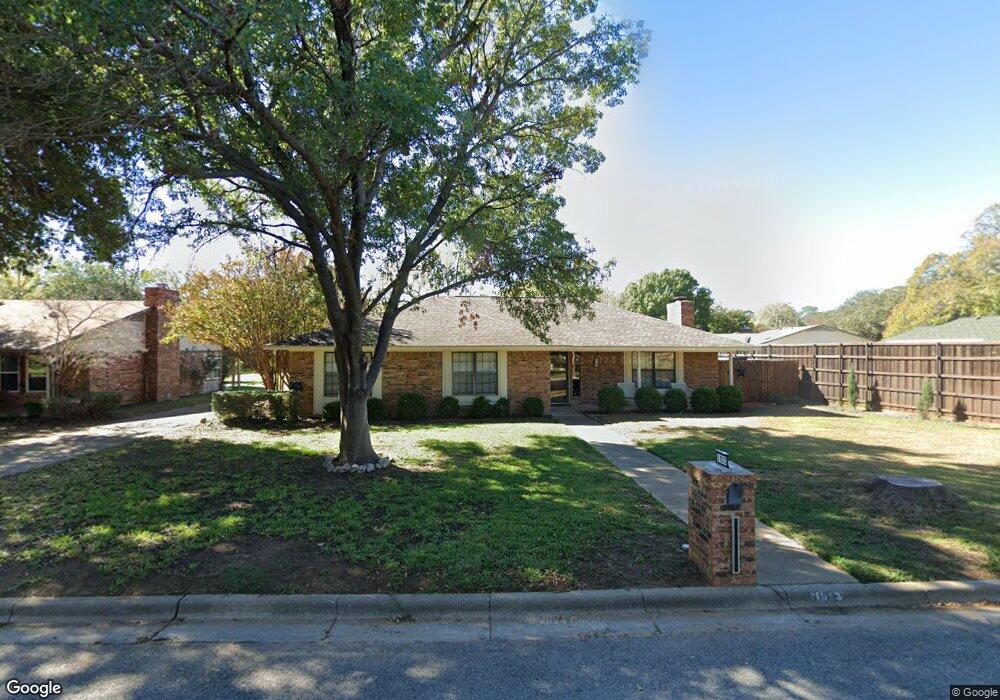
1923 Casa Loma Ct Grapevine, TX 76051
Estimated Value: $447,554 - $596,000
3
Beds
2
Baths
1,680
Sq Ft
$297/Sq Ft
Est. Value
About This Home
This home is located at 1923 Casa Loma Ct, Grapevine, TX 76051 and is currently estimated at $498,889, approximately $296 per square foot. 1923 Casa Loma Ct is a home located in Tarrant County with nearby schools including Dove Elementary School, Grapevine Middle, and Southlake Montessori.
Ownership History
Date
Name
Owned For
Owner Type
Purchase Details
Closed on
May 20, 2010
Sold by
Murphy Emma and Murphy Michael James
Bought by
Leung Tedmond
Current Estimated Value
Home Financials for this Owner
Home Financials are based on the most recent Mortgage that was taken out on this home.
Original Mortgage
$182,541
Outstanding Balance
$125,014
Interest Rate
5.5%
Mortgage Type
FHA
Estimated Equity
$373,875
Purchase Details
Closed on
Sep 29, 2006
Sold by
Kerlee Joe M
Bought by
Hall Emma
Home Financials for this Owner
Home Financials are based on the most recent Mortgage that was taken out on this home.
Original Mortgage
$147,250
Interest Rate
6.51%
Mortgage Type
Purchase Money Mortgage
Purchase Details
Closed on
Aug 25, 2000
Sold by
Bass Damon T and Bass Terri J
Bought by
Weidner John M
Home Financials for this Owner
Home Financials are based on the most recent Mortgage that was taken out on this home.
Original Mortgage
$139,050
Interest Rate
8.21%
Mortgage Type
VA
Create a Home Valuation Report for This Property
The Home Valuation Report is an in-depth analysis detailing your home's value as well as a comparison with similar homes in the area
Home Values in the Area
Average Home Value in this Area
Purchase History
| Date | Buyer | Sale Price | Title Company |
|---|---|---|---|
| Leung Tedmond | -- | Ameristar Title Co Inc | |
| Hall Emma | -- | American Title | |
| Weidner John M | -- | Safeco Land Title |
Source: Public Records
Mortgage History
| Date | Status | Borrower | Loan Amount |
|---|---|---|---|
| Open | Leung Tedmond | $182,541 | |
| Previous Owner | Hall Emma | $147,250 | |
| Previous Owner | Weidner John M | $139,050 |
Source: Public Records
Tax History Compared to Growth
Tax History
| Year | Tax Paid | Tax Assessment Tax Assessment Total Assessment is a certain percentage of the fair market value that is determined by local assessors to be the total taxable value of land and additions on the property. | Land | Improvement |
|---|---|---|---|---|
| 2025 | $1,314 | $409,523 | $76,629 | $332,894 |
| 2024 | $1,314 | $409,523 | $76,629 | $332,894 |
| 2023 | $4,925 | $379,140 | $50,260 | $328,880 |
| 2022 | $5,291 | $267,085 | $50,260 | $216,825 |
| 2021 | $5,731 | $268,932 | $50,260 | $218,672 |
| 2020 | $5,271 | $239,620 | $50,260 | $189,360 |
| 2019 | $5,501 | $241,205 | $50,260 | $190,945 |
| 2018 | $1,516 | $255,000 | $50,260 | $204,740 |
| 2017 | $5,897 | $255,000 | $50,260 | $204,740 |
| 2016 | $5,089 | $220,057 | $50,260 | $169,797 |
| 2015 | $3,606 | $157,200 | $30,000 | $127,200 |
| 2014 | $3,606 | $157,200 | $30,000 | $127,200 |
Source: Public Records
Map
Nearby Homes
- 1013 Mockingbird Dr
- 1323 Dublin St
- 2340 Bluebird Ct
- 914 Hummingbird Trail
- 1654 Choteau Cir
- 1626 Choteau Cir
- 1641 Choteau Cir
- 1827 Sonnet Dr
- 1902 Shorewood Dr
- 1508 Bennington Ct
- 1723 Autumn Ridge Ln
- 6007 Laurel Ln
- 6011 Laurel Ln
- 1985 Shorewood Dr
- 1002 Meadow Bend Loop N
- 1201 Circle View Ct
- 1916 Everglade Ct
- 1507 Country Forest Ct
- 1092 Rosewood Dr
- 841 Meadow Bend Loop W
- 1917 Casa Loma Ct
- 1103 Laguna Vista Way
- 1109 Laguna Vista Way
- 1909 Casa Loma Ct
- 1924 Casa Loma Ct
- 1918 Casa Loma Ct
- 1910 Casa Loma Ct
- 1932 Casa Loma Ct
- 1117 Laguna Vista Way
- 1941 Casa Loma Ct
- 1905 Casa Loma Ct
- 1940 Casa Loma Ct
- 1904 Casa Loma Ct
- 1112 Laguna Vista Way
- 1947 Casa Loma Ct
- 1123 Laguna Vista Way
- 1902 Casa Loma Ct
- 1946 Casa Loma Ct
- 1903 Casa Loma Ct
- 1123R Laguna Vista Way