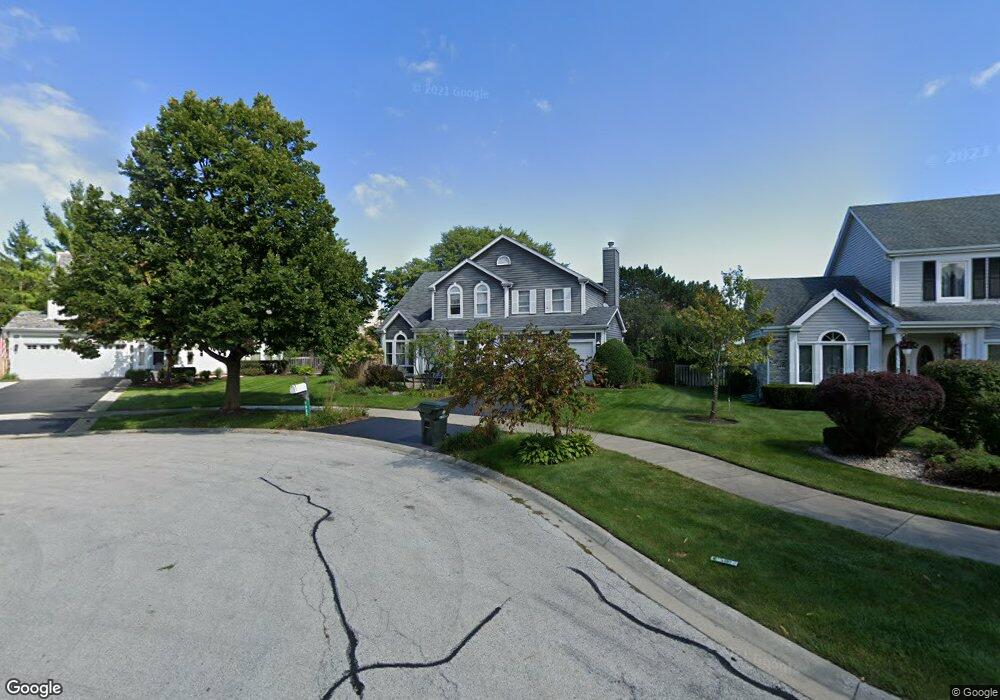
1923 Ivy Way Glenview, IL 60026
Estimated Value: $693,000 - $915,000
4
Beds
3
Baths
2,891
Sq Ft
$274/Sq Ft
Est. Value
About This Home
This home is located at 1923 Ivy Way, Glenview, IL 60026 and is currently estimated at $792,668, approximately $274 per square foot. 1923 Ivy Way is a home located in Cook County with nearby schools including Henry Winkelman Elementary School, Field Middle School, and Glenbrook South High School.
Ownership History
Date
Name
Owned For
Owner Type
Purchase Details
Closed on
Nov 3, 2020
Sold by
Dominguez David and Dominguez Vicki
Bought by
Dominguez Vicki and Dominguez Y
Current Estimated Value
Home Financials for this Owner
Home Financials are based on the most recent Mortgage that was taken out on this home.
Original Mortgage
$378,400
Interest Rate
2.8%
Purchase Details
Closed on
Jul 16, 2002
Sold by
Minkus Charles M and Minkus Suzanne S
Bought by
Dominguez David and Dominguez Vicki
Home Financials for this Owner
Home Financials are based on the most recent Mortgage that was taken out on this home.
Original Mortgage
$400,000
Interest Rate
6.5%
Purchase Details
Closed on
Jul 31, 1994
Sold by
Minkus Charles M and Minkus Suzanne S
Bought by
Minkus Charles M and Minkus Suzanne S
Create a Home Valuation Report for This Property
The Home Valuation Report is an in-depth analysis detailing your home's value as well as a comparison with similar homes in the area
Home Values in the Area
Average Home Value in this Area
Purchase History
| Date | Buyer | Sale Price | Title Company |
|---|---|---|---|
| Dominguez Vicki | -- | -- | |
| Dominguez Vicki | -- | -- | |
| Dominguez David | $500,000 | First American Title | |
| Minkus Charles M | -- | -- |
Source: Public Records
Mortgage History
| Date | Status | Borrower | Loan Amount |
|---|---|---|---|
| Previous Owner | Dominguez Vicki | $378,400 | |
| Previous Owner | Dominguez David | $400,000 | |
| Closed | Dominguez David | $50,000 |
Source: Public Records
Tax History Compared to Growth
Tax History
| Year | Tax Paid | Tax Assessment Tax Assessment Total Assessment is a certain percentage of the fair market value that is determined by local assessors to be the total taxable value of land and additions on the property. | Land | Improvement |
|---|---|---|---|---|
| 2024 | $11,555 | $56,626 | $8,924 | $47,702 |
| 2023 | $11,978 | $56,626 | $8,924 | $47,702 |
| 2022 | $11,978 | $59,000 | $8,924 | $50,076 |
| 2021 | $10,855 | $46,769 | $9,735 | $37,034 |
| 2020 | $11,659 | $52,042 | $9,735 | $42,307 |
| 2019 | $11,587 | $58,475 | $9,735 | $48,740 |
| 2018 | $10,066 | $47,055 | $8,518 | $38,537 |
| 2017 | $9,791 | $47,055 | $8,518 | $38,537 |
| 2016 | $10,030 | $47,055 | $8,518 | $38,537 |
| 2015 | $11,679 | $49,587 | $6,896 | $42,691 |
| 2014 | $11,357 | $49,587 | $6,896 | $42,691 |
| 2013 | $11,118 | $49,587 | $6,896 | $42,691 |
Source: Public Records
Map
Nearby Homes
- 4297 Linden Tree Ln Unit 7
- 3256 Westview Dr
- 3246 Landwehr Rd Unit 3
- 2308 Indian Ridge Dr
- 3190 Landwehr Rd
- 2073 Cambria Ct Unit 94K20
- 1594 Portage Run
- 3856 S Parkway Dr Unit 2A
- 3800 Kiess Dr
- 2503 Indian Ridge Dr
- 3820 Kiess Dr
- 1520 Magnolia St
- 1223 Milwaukee Ave
- 3026 Glenway Dr
- 2803 Wildflower Ct
- 4250 Meadowview Dr
- 1403 Forest Dr
- 4036 Miller Dr
- 2809 Meadowview Ct
- 3931 Miller Dr
- 1919 Ivy Way
- 4308 Ivy Ln
- 1912 Franklin Dr
- 1908 Franklin Dr
- 4312 Ivy Ln
- 1904 Franklin Dr
- 1915 Ivy Way
- 1916 Franklin Dr
- 4316 Ivy Ln
- 1900 Franklin Dr
- 1911 Ivy Way
- 1920 Ivy Way
- 4315 Hammersmith Ln
- 1920 Franklin Dr
- 4313 Hammersmith Ln
- 4320 Ivy Ln
- 1916 Ivy Way
- 4311 Westview Dr
- 1909 Ivy Way
- 4317 Hammersmith Ln