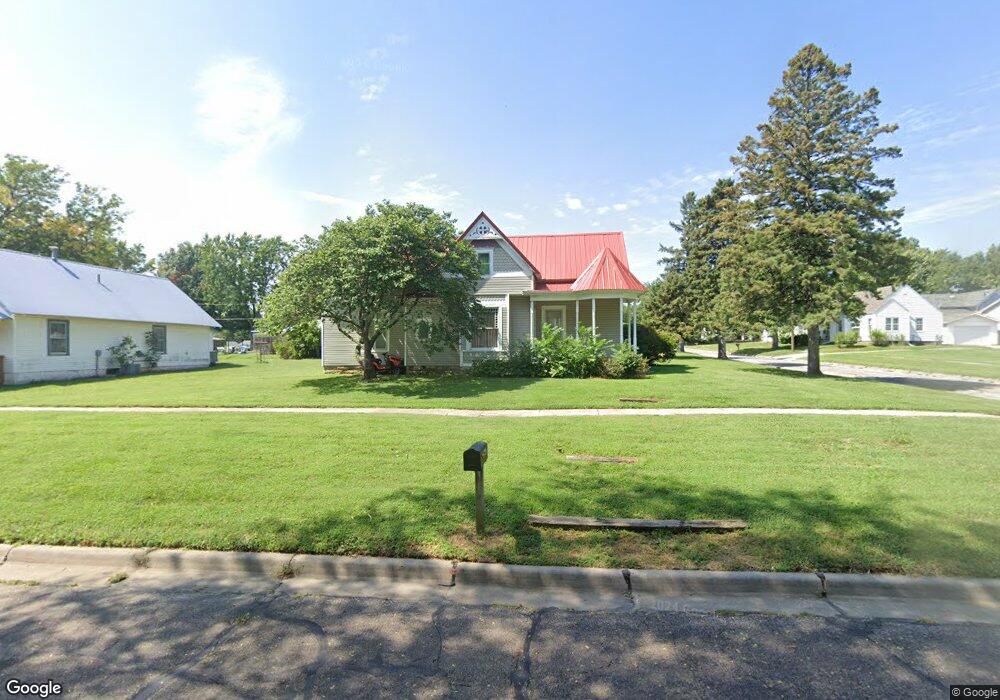
1923 Wilson St Falls City, NE 68355
Estimated Value: $49,000 - $102,000
2
Beds
1
Bath
1,724
Sq Ft
$44/Sq Ft
Est. Value
About This Home
This home is located at 1923 Wilson St, Falls City, NE 68355 and is currently estimated at $75,506, approximately $43 per square foot. 1923 Wilson St is a home located in Richardson County with nearby schools including Falls City North Elementary School, Falls City South Elementary School, and Falls City Middle School.
Ownership History
Date
Name
Owned For
Owner Type
Purchase Details
Closed on
Mar 7, 2025
Bought by
Frederick Steven E and Frederick Linda S
Current Estimated Value
Purchase Details
Closed on
Sep 29, 2005
Sold by
Centex Home Equity Corp
Bought by
Frederick David L and Frederick Steven E
Purchase Details
Closed on
Sep 28, 2005
Sold by
Centex Home Equity Company Llc
Bought by
Frederick David L and Frederick Steven E
Purchase Details
Closed on
Oct 8, 2004
Sold by
Hammitt Patricia A
Bought by
Centex Home Equity Corp
Create a Home Valuation Report for This Property
The Home Valuation Report is an in-depth analysis detailing your home's value as well as a comparison with similar homes in the area
Home Values in the Area
Average Home Value in this Area
Purchase History
| Date | Buyer | Sale Price | Title Company |
|---|---|---|---|
| Frederick Steven E | $10,000 | -- | |
| Frederick David L | $5,000 | -- | |
| Frederick David L | -- | -- | |
| Centex Home Equity Corp | $33,362 | -- |
Source: Public Records
Tax History Compared to Growth
Tax History
| Year | Tax Paid | Tax Assessment Tax Assessment Total Assessment is a certain percentage of the fair market value that is determined by local assessors to be the total taxable value of land and additions on the property. | Land | Improvement |
|---|---|---|---|---|
| 2025 | $397 | $36,659 | $5,400 | $31,259 |
| 2024 | $397 | $34,890 | $5,400 | $29,490 |
| 2023 | $717 | $43,684 | $5,400 | $38,284 |
| 2022 | $772 | $40,180 | $3,240 | $36,940 |
| 2021 | $682 | $36,380 | $3,240 | $33,140 |
| 2020 | $659 | $34,802 | $3,240 | $31,562 |
| 2019 | $652 | $33,883 | $3,240 | $30,643 |
| 2018 | $641 | $32,990 | $3,240 | $29,750 |
| 2017 | $642 | $32,990 | $3,240 | $29,750 |
| 2016 | $783 | $40,415 | $3,240 | $37,175 |
| 2015 | $785 | $40,415 | $3,240 | $37,175 |
| 2014 | $784 | $40,415 | $3,240 | $37,175 |
Source: Public Records
Map
Nearby Homes