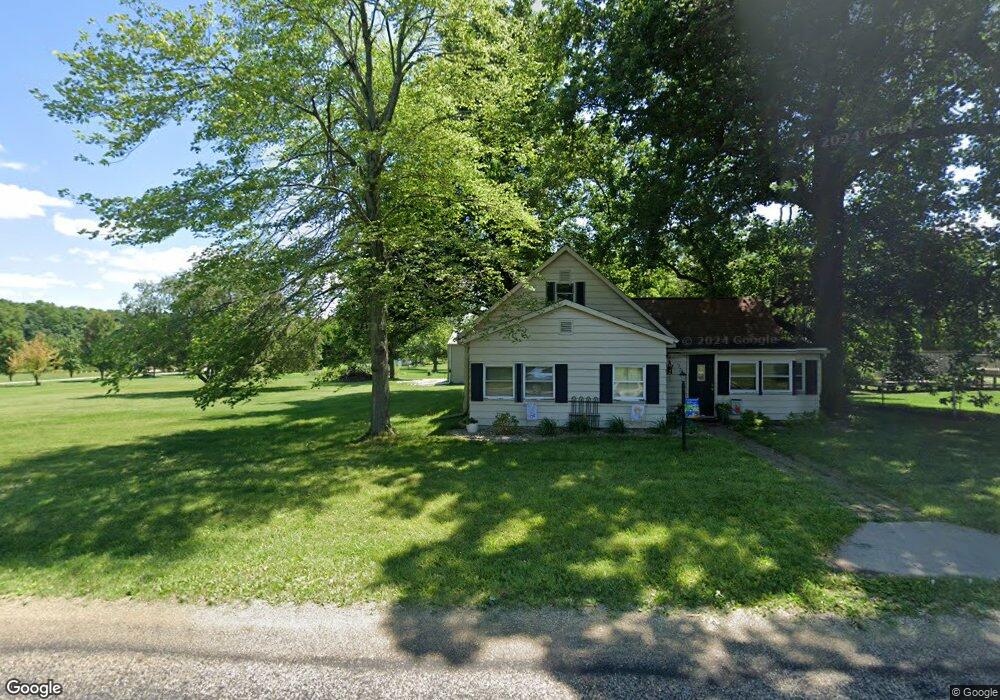
19235 E 850 North Rd Bloomington, IL 61705
Estimated Value: $94,000 - $143,425
3
Beds
1
Bath
1,166
Sq Ft
$106/Sq Ft
Est. Value
About This Home
This home is located at 19235 E 850 North Rd, Bloomington, IL 61705 and is currently estimated at $124,106, approximately $106 per square foot. 19235 E 850 North Rd is a home located in McLean County with nearby schools including Tri-Valley Elementary School, Tri-Valley Middle School, and Tri-Valley High School.
Ownership History
Date
Name
Owned For
Owner Type
Purchase Details
Closed on
Sep 27, 2019
Sold by
Ashenbremer Sharon K and Ashenbremer Christina H M
Bought by
Ashenbermer Brian L
Current Estimated Value
Purchase Details
Closed on
Aug 31, 2018
Sold by
Ashendbremer Christina H M
Bought by
Ashenbremer Sharon K and Ashenbremer Brian L
Purchase Details
Closed on
Aug 15, 2018
Sold by
Wells Fargo Bank
Bought by
Ashenbremer Christina Hm
Purchase Details
Closed on
May 11, 2018
Sold by
Haworth Nick E and Haworth Nick
Bought by
Wells Fargo Bank Na
Purchase Details
Closed on
Jun 22, 2011
Sold by
Peel Robert A and Peifer Kristin L
Bought by
Haworth Nick
Home Financials for this Owner
Home Financials are based on the most recent Mortgage that was taken out on this home.
Original Mortgage
$128,340
Interest Rate
4.63%
Purchase Details
Closed on
Jan 4, 2006
Sold by
Capodice John
Bought by
Peel Robert A and Peifer Kristin L
Create a Home Valuation Report for This Property
The Home Valuation Report is an in-depth analysis detailing your home's value as well as a comparison with similar homes in the area
Purchase History
| Date | Buyer | Sale Price | Title Company |
|---|---|---|---|
| Ashenbermer Brian L | $34,500 | Mclean County Title | |
| Ashenbremer Sharon K | -- | Attorney | |
| Ashenbremer Christina Hm | $50,013 | None Available | |
| Wells Fargo Bank Na | -- | None Available | |
| Haworth Nick | $124,000 | First Community Title | |
| Peel Robert A | -- | None Available |
Source: Public Records
Mortgage History
| Date | Status | Borrower | Loan Amount |
|---|---|---|---|
| Previous Owner | Haworth Nick | $128,340 |
Source: Public Records
Tax History
| Year | Tax Paid | Tax Assessment Tax Assessment Total Assessment is a certain percentage of the fair market value that is determined by local assessors to be the total taxable value of land and additions on the property. | Land | Improvement |
|---|---|---|---|---|
| 2024 | $2,295 | $32,171 | $10,938 | $21,233 |
| 2022 | $2,295 | $27,525 | $9,358 | $18,167 |
| 2021 | $2,181 | $26,000 | $8,528 | $17,472 |
| 2020 | $2,183 | $26,000 | $8,528 | $17,472 |
| 2019 | $3,300 | $39,283 | $8,528 | $30,755 |
| 2018 | $3,275 | $38,975 | $8,461 | $30,514 |
| 2017 | $3,223 | $38,320 | $8,319 | $30,001 |
| 2016 | $2,098 | $37,967 | $8,242 | $29,725 |
| 2015 | $2,071 | $37,696 | $8,183 | $29,513 |
| 2014 | $1,949 | $36,917 | $8,014 | $28,903 |
| 2013 | -- | $36,917 | $8,014 | $28,903 |
Source: Public Records
Map
Nearby Homes
- 500 Raef Rd
- 9580 Janel Dr
- 8198 Pine Ave
- 19977 Jared Dr
- 19889 Jared Dr
- 18864 Pioneer St
- 19066 Woodland Trail
- Lot 8 E 700 Rd N
- 8710 N 2100 East Rd
- 3903 Dunloe Place
- 1922 Dunraven Rd
- 1915 Dunraven Rd
- 1906 Dunraven Rd
- Lot 32 - 15875 Belfry Dr
- Lot 13 - 15850 Palmer Way
- 9821 Gabriel Dr
- Lot 14 - 15940 Crestwicke Dr
- 1517 Kell Ave
- 5104 Finlen Ln
- 5101 Londonderry Rd
- 19235 E 850 Rd N
- 19221 E 850 North Rd
- 19246 E 850 North Rd
- 19154 Denning St
- 19179 E 850 North Rd
- 19179 E 850 Rd N
- 19133 E 850 North Rd
- 19281 E 850 North Rd
- 19331 E 850 North Rd
- 19010 Commercial St
- 19022 E 850 Rd N
- 19022 E 850 North Rd
- 19356 E 850 North Rd
- 8533 N 1900 East Rd
- 8622 Prairie Trail
- 8444 Prairie Trail
- 8571 N 1900 East Rd
- 8466 Jeffrey Ct
- 8438 N 1900 East Rd
- 8636 Prairie Trail
Your Personal Tour Guide
Ask me questions while you tour the home.